


App Store analytics are good at reporting outcomes: installs, conversion rates, subscription starts and cancels. What they don’t do is help you make monetization decisions. The data is aggregated and stripped of context, so you know that something happened, but not why it happened and what to do about it.
In this article, we’ll break down:
- which App Store metrics are genuinely reliable and what they’re good for,
- where their decision-making value ends,
- why these metrics often fail to translate into action,
- and how web2app changes the analytics by giving you data early and granular enough to act on it.
TL;DR
- App Store analytics reliably report outcomes like visibility, installs, subscriptions, and revenue.
- They do not explain why users convert, churn, or respond to specific pricing, messaging, or offers.
- Privacy-first aggregation (ATT, SKAN) removes attribution, cohort analysis, and user-level context.
- Key monetization steps between install and subscription remain invisible in App Store analytics. As a result, App Store analytics are insufficient for making pricing, onboarding, and funnel decisions.
- Web2app funnels move measurement earlier in the journey and restore actionable signal. This enables real-time testing of messaging, pricing, and offers, so teams can act on data instead of reviewing outcomes after the fact.
What App Store analytics measure well
App Store does a solid job measuring what happens inside the store funnel before install and the fact that a user subscribed. This data is useful for understanding visibility, demand, and the very top layer of app growth metrics. Anything deeper than that is outside the store’s scope, but within these boundaries, the numbers are generally reliable.
Store page visibility and demand
Metrics like Impressions, Product Page Views, and their unique-device variants show how visible your app is inside the App Store ecosystem.
They’re useful for tracking:
- changes in discoverability after ASO updates,
- the impact of featuring,
- shifts in demand across time or territories.
At their core, they answer a simple question: are more people seeing and opening your App Store page?
Installs and store-level conversion
First-Time Downloads, Total Downloads, and App Store conversion rate measure how effectively your store page turns interest into installs. Teams use them to compare listing variants, evaluate copy and creative, and run App Store–level A/B tests.
Traffic source distribution
App Store analytics also show where installs originate inside the store: search, browse, paid campaigns, Smart App Banners, or cross-promotion via StoreKit. This helps teams understand:
- which discovery paths drive installs,
- how dependent acquisition is on specific sources,
- whether demand shifts after campaign or metadata changes.
This data shows how installs are distributed across App Store acquisition paths: search, browse, paid campaigns, and direct access. It’s useful for understanding where demand is coming from and how dependent installs are on specific sources.
Geographic distribution
Install and sales metrics broken down by territory provide a reliable picture of where demand exists. This data is commonly used for localization decisions, market prioritization, and regional scaling strategies.
Subscription events (high-level)
App Store analytics accurately capture subscription starts, renewals, cancellations, and paying users (but still at an aggregate level). These metrics are useful for monitoring macro trends, such as overall subscription growth or decline, changes in renewal volume, shifts in the size of the paying user base, and so on.
The path to those outcomes — pricing exposure, offer sequencing, user intent, or the timing of decisions leading up to the subscription — remains invisible.
Aggregate revenue and proceeds
Sales, Proceeds, and active subscriber counts provide accurate financial reporting. They’re essential for revenue tracking, forecasting, and accounting and finance workflows.
App Store analytics blind spots
The metrics above are good at signaling change: shifts in visibility, installs, or subscription activity. What they don’t explain is why those changes happen.
Since iOS 14.5 and the rollout of App Tracking Transparency (ATT), App Store analytics have deliberately moved away from user-level visibility. The remaining data is privacy-first and heavily aggregated. It records events, but strips away the context needed to connect them into a decision-making model.
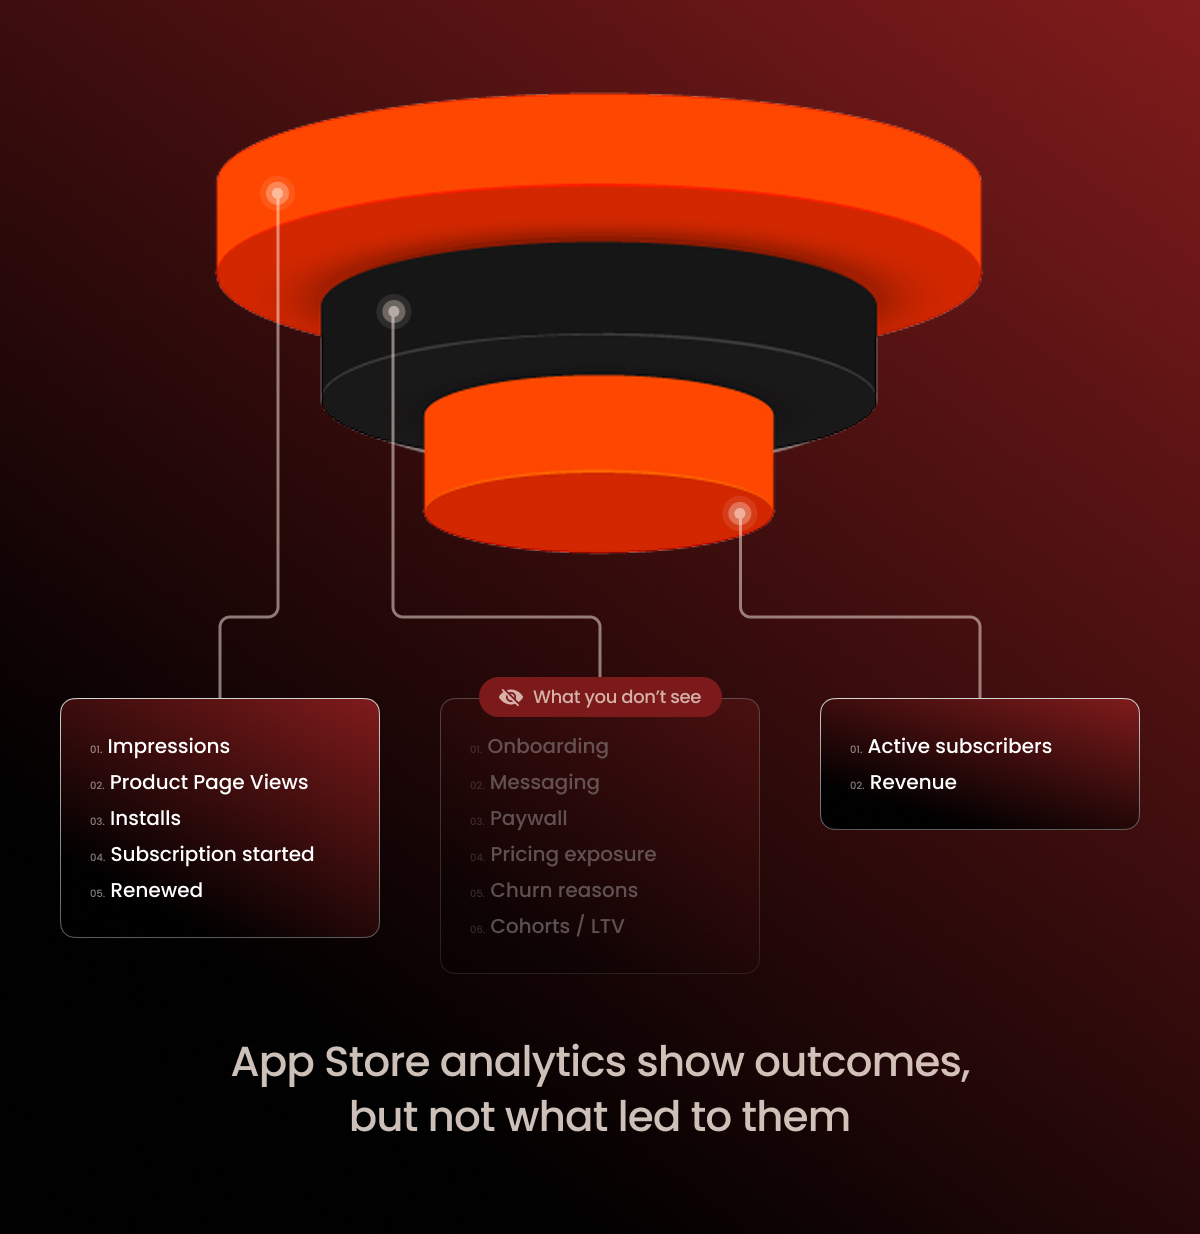
At the store level, you cannot see:
- Which user came from which campaign and how they converted.
After ATT, installs, behavior, and monetization no longer connect into a single user journey. You can’t reliably tell who the user is, where they came from, or how they ended up paying. - Which creative, message, or angle drove revenue.
You can observe outcomes — installs, subscriptions, proceeds — but you can’t tie them back to specific creatives, copy, or positioning choices. - How monetization performs by cohort.
Cohort data describes group outcomes. What drove those outcomes — which message, offer, or onboarding path made the difference — remains invisible; everything is rolled up into high-level totals. - What happens between install and subscription.
Activation, onboarding, paywalls, trial-to-paid conversion, upgrades, downgrades, and responses to pricing or packaging changes all sit outside what the App Store can observe or analyze. - How users behave across surfaces.
The App Store doesn’t connect web, app, email, CRM, or retargeting touchpoints. Cross-device and cross-channel behavior simply doesn’t exist in store analytics.
What changed in App Store Connect Analytics in March 2026
On March 25, 2026, Apple announced the biggest update to App Store Connect Analytics since its launch. For subscription apps, three additions are directly relevant: subscription and IAP performance data, cohort analysis by download date and source, and peer benchmarks for download-to-paid conversion and proceeds per download.
Partially closed:
- Revenue quality and structure. Subscription and IAP data now give teams visibility into which products and offers generate revenue over time.
- Cohort analysis. Download date, download source, and offer start date cohorts allow basic LTV and retention tracking by acquisition batch.
- Competitive benchmarking. Download-to-paid conversion and proceeds per download benchmarks provide a reference point that previously required third-party data.
Still closed:
- Attribution after ATT. Cohort data remains aggregated to protect user privacy. Individual-level attribution — connecting a specific user to a specific creative, campaign, or channel — remains outside what App Store analytics can provide.
- Creative-level revenue. You can observe that a cohort acquired via a specific source performs well, but you still cannot tie revenue outcomes to individual ad creatives, copy variants, or messaging angles.
- What happens between install and subscription. Onboarding, paywall exposure, trial behavior, and drop-off points remain invisible. The update adds more outcome data; it does not add funnel-level visibility into how those outcomes are reached.
- Cross-channel behavior. Web, email, CRM, and retargeting touchpoints remain disconnected from store analytics. The update operates within the App Store abstraction, not across it.
What this means in practice
The March 2026 update narrows some of these gaps — subscription performance and cohort-level tracking are now more accessible natively. But the core limitation remains: App Store analytics still describe outcomes, not the mechanics behind them.
If you rely only on App Store analytics, you never see how the subscription decision is actually formed. You can’t identify where users drop off, which messages resonate, which pricing plan works best, or how different segments perceive value. Those are the inputs that determine whether monetization scales or stalls — and they remain outside what the store can measure, regardless of the update.
These blind spots aren’t a tooling gap you can fix by digging deeper into the same data. They’re structural. Closing them requires a different level of visibility — one that exists outside the App Store abstraction.
Web2app gives you granular data early enough to act on it
Web2app funnels move analytics to where the conversion happens. You can change an onboarding step, an offer, a plan layout, or a message angle and immediately see how it affects your revenue.
That gives you data early enough to adjust the funnel, not just review results after everything is already over.
Direct visibility and attribution
Web2app restores the signal that app stores lost after ATT and SKAN. Instead of delayed, modeled postbacks, you work with direct signals on the web layer — from the first click and funnel entry to the paywall, checkout, and purchase.
That means you can see the funnel as a sequence, not a summary: how users progress step by step, where they drop off, which traffic sources and creatives bring in high-intent audience, and how different cohorts perform.
Web funnels allow faster testing than in-app releases
The biggest difference with web2app is iteration speed. In store-first setups, every hypothesis runs into the release cycle: build, review, rollout, then wait. By the time data stabilizes, weeks have passed and the context has already shifted.
With web2app, measurement happens as you make the change. The idea, the test, and the result all live in the same window, so you see what’s working while you can still react.
That changes how analytics are used. Instead of validating decisions after they’re locked in, you see direction early, while adjustments are still low-effort and reversible. Signals appear sooner, and patterns emerge before they get buried inside long-term aggregates.
Messaging, pricing, and offers can be iterated without app updates
With web2app, core monetization levers — value framing, pricing, and offer structure — live outside the app. That lets teams change one variable at a time and isolate its effect, without bundling it into a full app release.
Instead of a binary outcome (subscribed or not), you can observe how users react to a specific message, price point, or offer layout. The focus shifts from measuring the subscription event to understanding what influenced it, creating a clean connection between entry context, the offer shown, and payment behavior.
Web2app flows turn store-level signals into controllable experiments
App Store analytics give you signals — shifts in installs, conversion rates, geography, or subscription activity. On their own, these signals describe change, but don’t indicate what to adjust.
Web2app adds the missing step: the ability to turn a signal into a concrete hypothesis and test it. Growth from a new geo becomes a test of localized messaging. A drop in conversion rate turns into a test of an alternative promise or offer structure. A shift toward annual payments becomes a reason to isolate and iterate on that specific offer.
As a result, metrics stop being a dead end and turn into a trigger for focused experiments. Instead of passively observing store data, you can act on it in real time.
FunnelFox as infrastructure behind revenue-driven web2app funnels
For web2app to work as a real monetization and decision-making model, you need infrastructure that lets you build and change funnels quickly and immediately see how those changes affect conversion. That’s where FunnelFox fits in.
FunnelFox is a no-code platform for building and running web2app funnels. It combines a visual funnel builder with modern billing infrastructure, so you can manage onboarding, messaging, offers, pricing, and payments in one place, quickly, and without waiting for the App Store approvals.
With FunnelFox, you get a clear view of how users move through your web2app funnel and where conversion and revenue are created or lost.
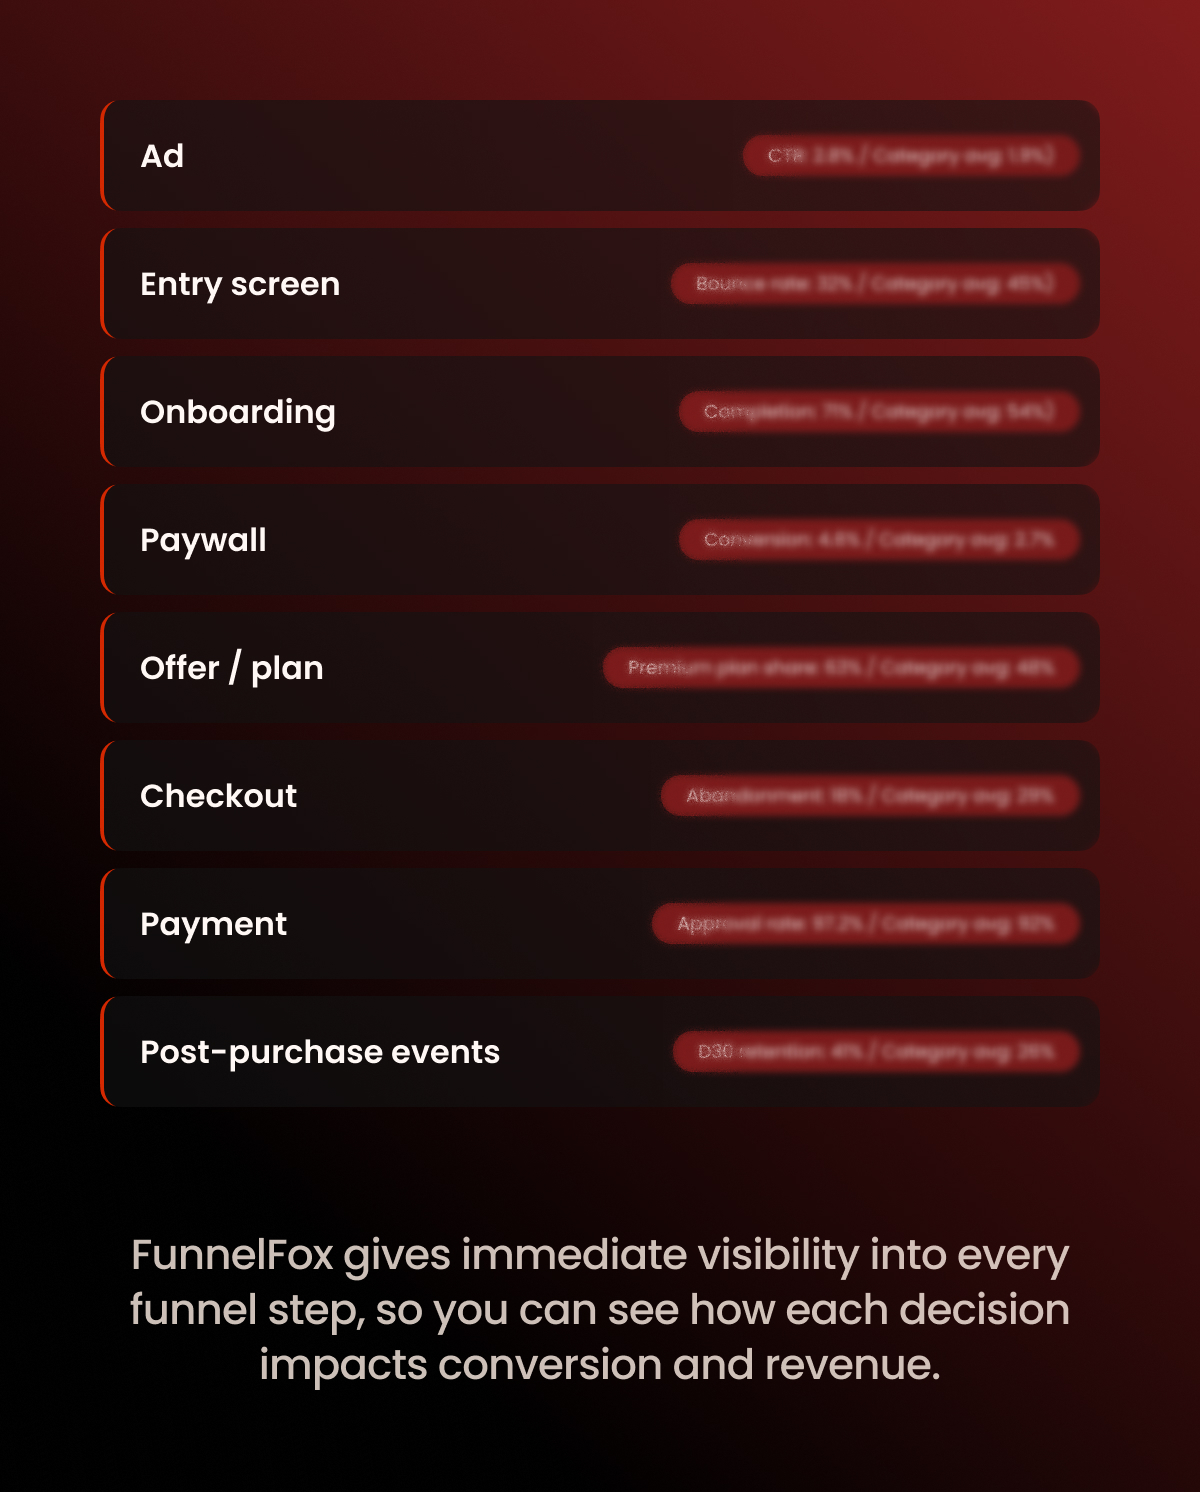
At the funnel level, you can see:
- conversion rates across key transitions, including start to second screen, start to paywall, paywall to purchase, start to purchase, and purchase to CTA,
- step-level performance by screen intent, such as auth, paywall, upsell, and finish screens,
- drop-off points that show where users disengage before reaching the offer or completing a purchase.
On the revenue side, funnel data stays connected to payment outcomes. You can break metrics down by:
- product, such as subscription tiers or one-time purchases,
- currency and payment provider,
- funnel, funnel version, and A/B experiment,
- billing reason, including initial purchases, renewals, upgrades, and one-time charges.
This makes it possible to analyze not just total revenue, but how it’s formed. You can track ARPU and ARPPU, compare cohorts over time, and see how subscriptions evolve after the first transaction. Events such as trials, renewals, refunds, chargebacks, pauses, and cancellations remain analyzable by funnel and experiment, enabling cohort-level revenue and LTV analysis without breaking attribution.
If web2app is on your roadmap and you want transparent, decision-level funnel and revenue analytics, book a FunnelFox demo.
Wrap-up on App Store analytics
App Store analytics are retrospective by design. They work early on, but break down once teams start working seriously on monetization.
Web2app fills that gap. It gives access to data that’s both earlier in the funnel and more granular, allowing teams to see intent, behavior, and drop-offs before revenue is locked behind App Store abstractions. Instead of reacting to outcomes, you can act on signals.
In a setup where App Store takes a meaningful cut but offers little room to act, web2app becomes less of an optimization tactic and more of a control layer — one that enables monetization decisions based on timely, actionable data rather than delayed summaries.