


Your dashboard shows the usual suspects: churn, conversion, revenue. Helpful? Sure. But not if you’re trying to figure out exactly what’s pushing your product forward or holding it back.
Most subscription analytics show you what’s happening, but not why. They compress user behavior into averages and hide the story underneath.
Cohort data flips that. Instead of showing one big number, it lets you track how different user groups behave over time — who sticks, who churns, why it happens, and what patterns stand out.
Let’s explore how cohort-based subscription analytics helps you see what’s really going on and how to use it to make better product and monetization decisions.
Why standard subscription analytics isn’t enough to make good decisions
Standard analytics connect the dots on what happened, but rarely explain why. You might see where subscribers came from. You’ve got UTMs, source tags, campaign IDs — that part is easy.
What you do not see is what drove the conversion. Was it the offer? The onboarding flow? Will they stick around, or churn before month two?
What you also don’t see is which channel brings high-LTV users. Two channels might convert at the same rate, but one cohort stays and pays, while the other churns after a single cycle.
With standard subscription analytics, you’re looking at an average, and averages are bad at explaining behavior. They compress different user segments, acquisition paths, billing flows, and product experiences into a single number. And in the process, they erase the very context you need to make informed decisions.
That’s risk. You might optimize a paywall based on aggregate conversion, while missing that the variant leads to higher churn after onboarding. You might see stable MRR, while one specific cohort is quietly collapsing and dragging LTV with it.
Without granularity, you’re guessing. That’s where cohort-based subscription analytics comes in. It doesn’t give you more data — it gives your data structure.
Cohort analysis lets you segment by how users enter your product, what path they follow, and how they behave over time. That’s how you stop reacting to symptoms and start identifying causes.
What is cohort analysis in a subscription model?
Cohort analysis shifts your focus from aggregate outcomes to behavioral patterns.
Instead of asking “how is retention trending?”, you start asking “how does retention look for users who signed up through X channel, saw Y paywall, and started a trial last week?”
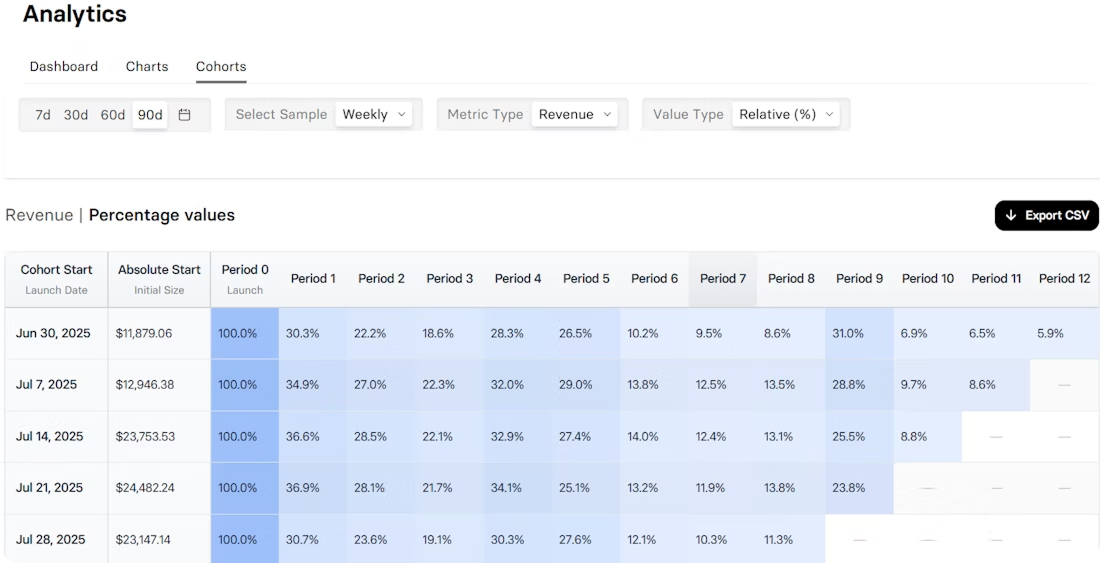
Source: FunnelFox Cohorts
How to define a cohort?
A cohort is a group of users who have the same starting point, like installing the app, starting a trial, or making their first payment. The shared starting point makes their behavior comparable over time.
Instead of blending your entire user base into a single retention curve, cohort analysis slices it into groups and tracks how each one performs across key moments: day 1 retention, week 2 churn, month 3 renewal, and so on.
How do you segment cohorts?
However you want, as long as it reflects the user context.
- Acquisition source (e.g., Meta vs organic)
- Funnel variant (e.g., onboarding A/B test)
- Billing provider (e.g., Stripe vs Paddle)
- Geography or platform, and so on
These segmentations help isolate the effects of product changes, marketing experiments, and infrastructure decisions over time.
Why it matters
Surface-level metrics don’t lie, but they leave a lot out.
That winning campaign might bring users who never renew. That new paywall with higher conversion might be overpromising and underdelivering.
With cohorted data, you can trace those outcomes to their sources. You can see not just what changed, but for whom, when, and with what long-term effect.
Key metrics in cohort-based subscription analytics
Cohort analysis is only as good as what you track. It’s not the slicing itself that generates insight, it’s what you measure within each slice.
Here are six metrics that consistently reveal actionable patterns in subscription products across activation, retention, billing, and revenue.
Retention over time (D1, D7, D30, D90)
Retention is foundational in cohort analysis. By comparing retention curves across different cohorts, you can see where and when user value erodes.
Do users drop off after onboarding? After the trial ends? After first billing? Month two?
Cohort-based retention gives you those answers.
Trial-to-paid conversion by cohort
Not all trials convert the same, even if the numbers say they do. Slice by channel, trial length, or onboarding to see which cohorts move to paid and which are dropping off.
It also helps you avoid false positives that look great in aggregate, but flop when segmented.
First-time payment failure rate
A metric often overlooked, but critical. Failed initial payments often correlate with poor LTV and churn.
By cohorting users based on billing method or country, you can identify whether friction is technical, regional, or UX-driven.
It’s also an early signal: if this rate is high for a cohort, retention and revenue will likely suffer downstream.
Revenue recovery rate
This metric shows what percentage of failed payments are recovered through retries, dunning flows, or manual interventions, cohort by cohort.
You might find that recovery is working well for Stripe, but not for Paddle. Or that international cohorts respond better to longer retry windows.
LTV by cohort
Compare users by acquisition source, pricing plan, onboarding variant, and other cohort attributes to identify which cohorts create lasting value and which don’t. It helps you see beyond conversion into real monetization efficiency.
Cancellation timing
Churn happens at different points in the user lifecycle.
By analyzing when cancellations occur, you can better understand the underlying causes and choose the appropriate response, whether it’s onboarding adjustments, pricing changes, or improvements to the cancellation flow.
4 Insights you’ll only see with cohort data
Cohort analysis surfaces patterns you won’t see in top-level metrics. Here are a few examples of what you can spot and what to do when you do.
1. A/B paywall test improves conversion, but retention collapses
Higher conversion can look promising until the cohort churns early.
This often points to a gap between what the paywall promises and what users experience after subscribing.
Instead of discarding the variant, adjust onboarding or product positioning to better align with expectations.
2. Paddle cohorts show higher churn than Stripe
Billing tools affect more than transaction success. Differences in retry logic, authentication, or fraud rules can impact churn and recovery.
Segment cohorts by provider and compare not just conversion, but payment success and retention over time.
These differences become more visible (and more costly) as you scale.
3. “Pause subscription” option reduces cancellations
When users choose to pause instead of cancel, it shows there’s still perceived value.
This creates opportunities for reactivation flows, targeted communication, and better end-of-cycle engagement.
4. Country-specific cohorts underperform
When churn varies by country, don’t start with localization or pricing. Check for billing issues first — unsupported payment methods, tax rules, currency handling, or decline rates.
These often affect retention more than UX and may require changes in your payment stack, not the product itself.
Wrap-up on cohort data in subscription analytics
Subscription metrics are easy to get, but most are only snapshots. To see how your product really performs, you need to track what happens over time and across cohorts.
Cohort data adds that missing layer. It helps you move from averages to patterns, from symptoms to causes. The result is clearer retention, stronger monetization, and fewer blind spots.
And in a subscription model, that’s the difference between a product that slowly leaks and one that compounds.
Go from patterns to product moves
Cohort data is only powerful if you can actually use it. That’s why we built Cohorts in FunnelFox — to bring clarity to your retention, revenue, and churn patterns.
See how different segments behave after their first payment, trial, or upsell. Spot issues early. Compare billing providers, paywalls, and pricing tests — and know exactly where growth is coming from.
All in one dashboard. Purpose-built for subscription apps.