


Web2app funnels revenue measurement is different from traditional App Store revenue tracking. While many teams celebrate improved conversion rates and CAC payback, these metrics don’t reveal whether your web2app revenue model is sustainable or profitable at scale.
This guide shows you how to measure web2app funnels revenue correctly, which metrics matter most, and how to avoid common measurement traps that cause teams to scale unprofitable channels.
TL;DR: How to measure web2app revenue
Web2app funnels revenue measurement is different from app store tracking. Here’s what matters:
✓ Track net revenue, not gross (account for 3-5% payment fees vs 15-30% app store fees)
✓ Monitor LTV at Day 30, 60, 90 — web2app typically shows 25-56% higher LTV with annual plans
✓ Separate web2app and app store cohorts — they behave differently and shouldn’t be blended
✓ Watch refund timing — web refunds process in 5-10 days (vs 2-4 weeks for app stores)
✓ Wait 60-90 days for meaningful cohort data before scaling spend
Key insight: Web2app revenue is more transparent with lower fees, but requires you to manage payment failures and renewal logic that app stores handle automatically.
Web2app vs App Store revenue: What’s the difference?
Understanding how web2app funnels revenue differs from app store revenue is critical for accurate measurement. Here’s what changes:
| Revenue factor | App Store revenue | Web2App revenue |
| Fees | 15-30% to Apple/Google | 3-5% to payment processor (Stripe, Paddle) |
| First-year LTV | Lower (benchmark: baseline) | 25-56% higher depending on pricing structure |
| Refund processing | 2-4 weeks (via Apple/Google) | 5-10 business days (direct control) |
| Retention tracking | Automatic renewals via store | Manual retry logic, dunning, recovery |
| Revenue visibility | Delayed, aggregated reports | Real-time, user-level tracking |
| Attribution | SKAN (modeled, delayed) | User-level, deterministic |
Why web2app funnel conversion rate isn’t the full story
Two funnels can have identical conversion rates but vastly different revenue outcomes.
Example scenario:
- Funnel A: 5% CR, yearly plans, low refunds → strong LTV
- Funnel B: 5% CR, monthly plans, high churn → weaker LTV
On paper, these funnels look identical. In practice, Funnel A might be generating 2x the revenue per user by Month 6.
That’s because conversion rate measures a single moment—the purchase decision—while ignoring everything that determines whether that purchase was actually worth acquiring.
Where real revenue comes from
Several factors beyond conversion rate determine whether a funnel is actually profitable:
- Pricing structure: Monthly vs. annual plans drive very different cash flow and retention;
- Refund behavior: Web users may refund at different rates than app users;
- Churn timing: When users cancel matters as much as whether they cancel.
Data insight: FunnelFox’s 2026 Web2App State Report shows the dramatic impact of pricing structure on LTV:
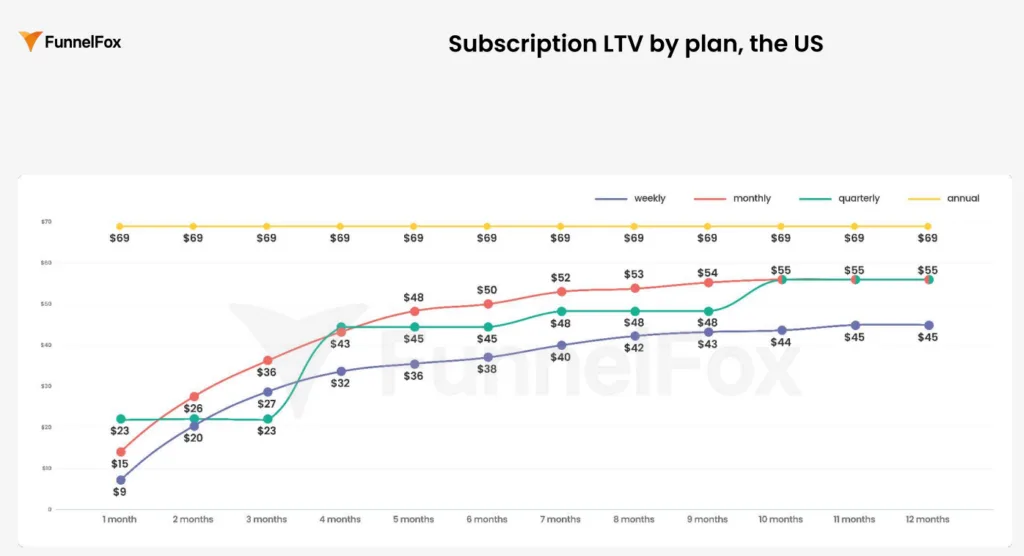
By Month 10, an annual subscriber generates $69 in LTV—a flat, predictable line from day one.
Meanwhile, weekly and monthly plans plateau around $44-55, climbing slowly through churn and renewals. Pricing structure alone can create a 25-56% LTV gap between otherwise identical funnels.
👉 Full report:Funnelfox State of web2app 2026
Web2app funnel metrics that actually matter
1. Net revenue after fees
What it is: Revenue after payment fees, refunds, chargebacks, and taxes.
Why it matters: Gross revenue misleads. A $100 purchase on web might net you $94. Through Apple, that same $100 drops to $70-85 after store fees.
How to track: Report revenue by payment method and geography.
- Web checkout: ~3-5% fees;
- Geography-specific taxes and VAT.
Formula:
Net Revenue = Gross Revenue – (Payment Fees + Refunds + Chargebacks + Taxes)
Example:
- Funnel A (web): $100 gross → $94 net (6% fees)
- Funnel B (Apple): $100 gross → $70 net (30% Apple fee)
→ Same conversion, 34% revenue difference
2. Refund and churn behavior (not just aggregate churn rate)
What it is: When users refund, pause, or cancel—and why.
Why it matters:
- High Month 1 refunds signal value mismatch or bad creative-to-product fit;
- Month 3-6 churn reveals retention issues that don’t show up in early metrics;
- Refund patterns can vary by channel (Meta, TikTok, Google) and campaign.
How to track:
- Refund rate by cohort week (Week 1, Week 2, Week 4);
- Time-to-churn distribution (when do most cancellations happen?);
- Churn reasons if captured in cancellation flow.
What to look for:
- Refund spikes correlated with specific channel or campaign;
- Cancellation patterns tied to onboarding quality or feature gaps.
Example:
- Cohort A: 8% Week 1 refunds, 15% Month 3 churn
- Cohort B: 3% Week 1 refunds, 8% Month 3 churn
→ Cohort B has better creative-product fit and higher LTV potential.
💡 Want to dive deeper into cohort analysis? Learn how to track and analyze cohorts effectively in our guide.
3. Net revenue per user and ARPPU (not just CAC payback)
What they are:
- Net revenue per user: Total net revenue ÷ all users in cohort
- ARPPU (Average Revenue Per Paying User): Net revenue ÷ paying users only
Why both matter: CAC payback shows when you break even—but not if the channel is worth scaling long-term. Net revenue per user shows blended monetization across your entire funnel. ARPPU reveals how much value you extract from those who convert.
Together, they show whether you’re acquiring the right users at the right price.
How to track: Break down by cohort, plan type, and acquisition source.
- Web2app cohort net revenue per user at Day 30, 60, 90;
- Compare ARPPU across annual vs monthly plans;
- Segment by channel to see which brings higher-value users.
Formulas:
Net Revenue Per User = Total Net Revenue / Total Users in Cohort
ARPPU = Total Net Revenue / Paying Users
Example:
- Funnel A: 5% conversion, $40 ARPPU = $2 net revenue per user
- Funnel B: 3% conversion, $80 ARPPU = $2.40 net revenue per user
→ Funnel B wins despite lower conversion.
👉Discover when to use ARPU vs. ARPPU
4. Incremental vs. cannibalized revenue
What it is: Are you creating new revenue or just shifting existing users from app stores to web2app?
Why it matters:
- Web2app unlocks new audience (Meta reports only 15% overlap between app and web campaigns);
- But some web cohorts might just be app users taking a different path;
- Real growth comes from incremental revenue, not channel-shifting.
How to track:
- Compare total revenue before and after launching web2app;
- Track install-to-web ratios (are app installs declining as web2app grows?);
- Measure LTV:CAC ratio separately for web vs app cohorts.
What to look for: Overall revenue should grow, not just redistribute. CAC efficiency: web2app cohorts should deliver 3:1 LTV:CAC or better.
Example:
- Before web2app: $500K monthly revenue, 10K app installs
- After web2app: $750K monthly revenue, 8K app installs + 5K web purchases
→ $250K is incremental revenue (not cannibalized)
5. LTV and unit economics in web2app
What it is: Understanding the long-term value and cost structure of web-acquired users.
Why it matters:
- LTV determines whether your growth model is sustainable;
- Unit economics reveal if each cohort contributes positively to your business after all costs;
- Web2app’s lower fees create opportunities for better unit economics, but only if retention holds.
How to track:
- Calculate LTV at multiple time horizons (Day 30, 60, 90, 180);
- Track unit economics: (LTV – CAC – operating costs per user);
- Monitor how pricing experiments affect both immediate conversion and long-term retention.
Key insights for web2app LTV optimization:
- Web2app typically achieves 1.33x better subscription retention compared to app-only campaigns;
- First-year LTV on web averages $100 vs $50 for iOS app campaigns (US market, 2024 benchmarks);
- Upsells and upgrades can increase LTV by up to 20%;
- Lower commission fees directly impact net LTV;
- Higher LTV allows for higher CAC targets, enabling more ambitious scaling.
The difference between healthy and unhealthy LTV curves becomes visible around Month 3. Healthy curves flatten into a stable retention plateau. Unhealthy curves keep declining, suggesting fundamental issues with value delivery.
What to look for:
- LTV curves that stabilize (not continuously declining) by Month 3-6;
- Positive unit economics by Day 90 at minimum;
- LTV:CAC ratios of 3:1 or better as a signal for scaling;
- Cohort behavior consistency—if early cohorts show strong LTV but later cohorts decline, investigate creative fatigue or audience saturation.
One warning sign many teams miss: when web-acquired LTV looks strong initially but degrades as you scale traffic. This usually means your first cohorts had unusually high intent, and the channel can’t maintain that quality at volume.
Why web2app breaks your old success metrics
The user journey is fundamentally different
In-app: Install → onboard → paywall → subscribe (all in one environment)
Web2app: Click ad → web funnel → purchase → install app → activate (split across platforms)
Behavioral differences show up in:
- How users discover value;
- How quickly they activate post-purchase;
- How fees and refunds are processed.
Post-purchase behavior diverges
In-app purchases lock users into Apple/Google’s renewal flow (automatic, frictionless).
Web2app purchases give you control—but also responsibility for failed payments, dunning, retry logic.
Key differences:
- Users who pay on web but never download the app create “revenue without engagement”;
- Retention curves may look different;
- Failed payment rates are higher on web (no Apple/Google handling retries);
- Refund patterns may differ;
- Web-acquired users may activate slower (they still need to download the app);
This lag can make early metrics misleading.
Common measurement traps (and how to avoid them)
1. Stopping at conversion
Why it happens: Conversion is fast, visible, and feels like validation.
The problem: You haven’t seen refunds, churn, or LTV yet.
Fix: Set a rule—don’t call a test “successful” until you have at least 30 days of cohort data.
2. Celebrating short-term revenue
Why it happens: Dashboards default to it; stakeholders want quick wins.
The problem: Upfront revenue from annual plans looks great until refunds and churn hit.
Fix: Track net revenue and profit per cohort, not gross revenue.
3. Ignoring refunds and churn because they lag
Why it happens: Refunds come in days or weeks later; churn shows up after billing cycles.
The problem: Early “wins” disappear when the real retention curve emerges.
Fix: Build refund rate and churn tracking into your core dashboard from day one.
Many teams track refunds as an aggregate percentage, but that hides critical patterns. A 5% refund rate could mean 5% of users refund within 48 hours (bad), or 5% refund gradually over 90 days (less concerning). The timing tells you whether the issue is value mismatch or just normal friction.
4. Declaring success too early
Why it happens: First web2app cohorts often overperform (novelty effect, high intent, selection bias).
The problem: Performance regresses to the mean as you scale traffic.
Fix: Wait for at least 2–3 cohorts before scaling spend.
Your first web2app cohort might include early adopters, users from high-intent creative tests, or simply people who were curious enough to try something new. As you scale, you’re acquiring users with lower intent and different expectations. What worked for 1,000 users might not work for 10,000.
📈 Measuring impact is step one. Growing revenue comes next. Read our web-to-app revenue guide.
How to set up revenue measurement correctly
Step 1: Define your revenue truth metric
Start here: Net revenue per cohort after all fees, refunds, and chargebacks.
Bonus: Break it down by traffic source, creative type, or funnel variant.
Step 2: Track web2app and in-app cohorts separately
Don’t blend them in aggregate reports.
Compare retention curves, churn timing, LTV at 30/60/90 days. Identify behavioral differences early.
Step 3: Build a cohort dashboard
Structure:
- Rows = cohorts (by week or month);
- Columns = time periods (Day 7, Day 30, Month 2, Month 3…);
- Cells = key metrics (net revenue, active subscribers, churn %, ARPPU, LTV);
This view reveals when cohorts stabilize, where churn spikes, which cohorts are truly profitable.
Step 4: Set experiment success criteria upfront
Example criteria:
- Net revenue per user (after fees/refunds) must exceed in-app baseline by 15%;
- Day 30 churn must be ≤ app baseline + 5%;
- CAC payback within 60 days;
Agree on these before launching tests—not after you see the data.
How FunnelFox makes accurate measurement possible
The problem with fragmented data
The core challenge is fragmented data. Payment data lives in Stripe, Paddle, or Adyen. App data sits in analytics tools or App Store Connect. Ad data is spread across Meta, TikTok, and Google.
Because these systems aren’t synced, it’s hard to see the full picture. Most teams can’t connect the dots—so they end up guessing.
What FunnelFox provides
Unified revenue tracking: Web purchases, app events, subscription status, and churn in one place.
Cohort analysis out of the box: See revenue and churn by cohort without building custom dashboards.
Experiment accountability: A/B test variants are tracked end-to-end, from click to LTV.
Fee-aware reporting: FunnelFox accounts for payment processing costs, so net revenue is always visible.

Revenue impact of web2app funnels: Key takeaway
Real revenue impact shows up in net revenue, retention, and profit per user.
Measure what matters: Track cohorts, account for fees, and don’t declare success until you’ve seen churn and refunds.
Avoid the traps: Don’t stop at surface metrics, don’t ignore lagging indicators, and don’t scale before you’ve validated sustainability.
With the right infrastructure—like FunnelFox’s unified tracking and cohort tools—you can measure web2app revenue impact with confidence and scale what actually works.FAQ