


A/B testing in web-to-app isn’t about improving things just to improve them. It’s about identifying what drives conversions through systematic experiments based on real data.
This guide explains how to organize A/B testing for web-to-app, which funnel elements to test, and how to measure results.
What are the benchmarks for funnel conversion?
Here’s the average CR at each step of the funnel:
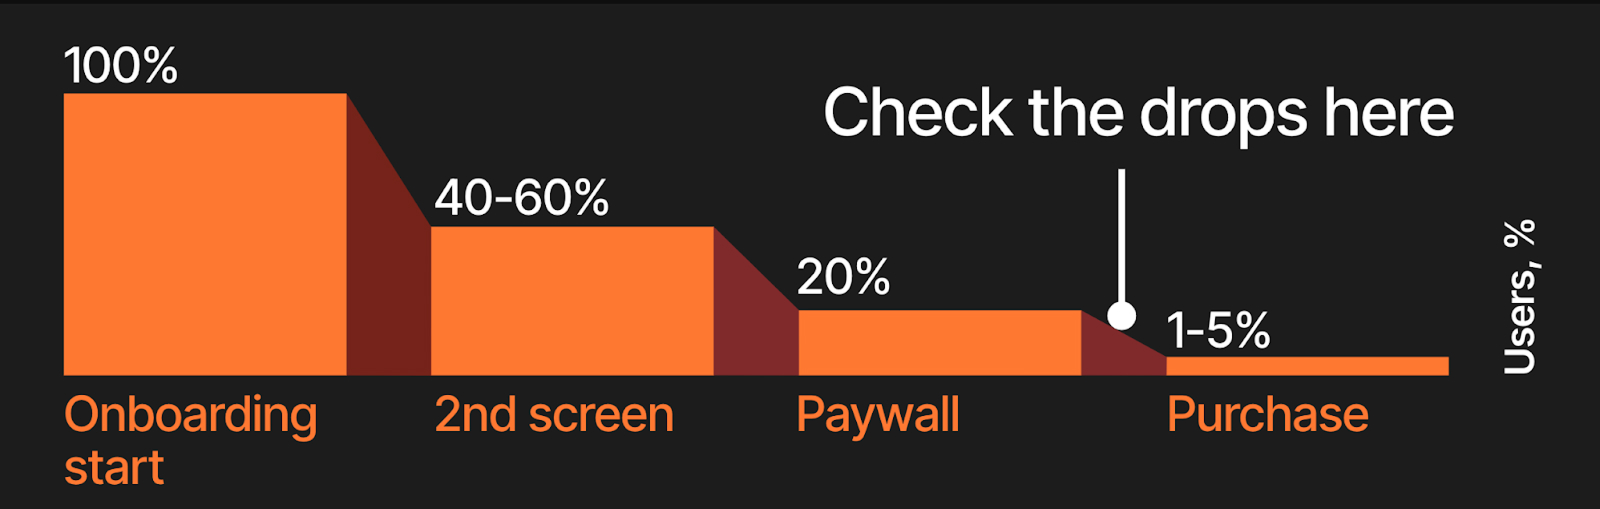
These are rough numbers, and don’t get us wrong — hitting them is solid, but there’s always room for improvement. The ultimate goal of funnel testing is to maximize overall conversion from the first screen to purchase. Even if some intermediate steps show higher drop-offs, what matters is improving the total conversion rate.
What funnel elements to A/B test?
Quiz onboarding
If you’re facing low onboarding conversion, the chances are you made one (or more) of these mistakes:
- Inconsistent storytelling, no match with the ad creative
- Irrelevant questions
- Low warming up: no personalization, value/expected result is not revealed
The goal of your onboarding is to engage, explain the value of your app, and convince users to purchase. Though it may seem logical to optimize onboarding for reaching the paywall (completion rate), the most important metric to focus on is the purchase conversion rate. Choose hypotheses for onboarding A/B testing with this question in mind—how is it expected to increase purchase conversion?
What to A/B test on the onboarding?
- First screen — different headlines, CTA placements, and visuals
- Storytelling — direct vs. aspirational messaging, long-form vs. concise explanations, or social proof vs. feature-based storytelling
- Feedback loops (your instant responses to the user’s answers) — frequency and messaging
- Warming loaders — real-time progress indicators, checkmarks, dynamic responses
- Positive friction — email collection, interactive steps like taking a selfie or scanning a palm, and micro-surveys encourage users to invest in the process and feel more connected to the product
We almost hear you asking “What about the onboarding length?”. The thing is, your onboarding should have as many screens as is sufficient to engage users and clearly communicate your app’s value, be it 10 or 100 screens. However, you still may A/B test a fast-tracked onboarding quiz vs. a longer, more immersive flow.
↘ Learn how to build high-converting onboarding in 6 steps
Paywall & checkout A/B testing
Even minor tweaks on the paywall can have a major impact on key metrics. If there are no significant drops between the second screen and the paywall, then that’s the weak spot to test and optimize. The typical problems that kill conversion on the paywall are:
- No clear value in the offer, no match with storytelling
- Weak value visualization
- Low warming up: no personalization, timers, social proof, etc.
- Weak CTA: Pay/subscribe button, poorly highlighted button, etc.
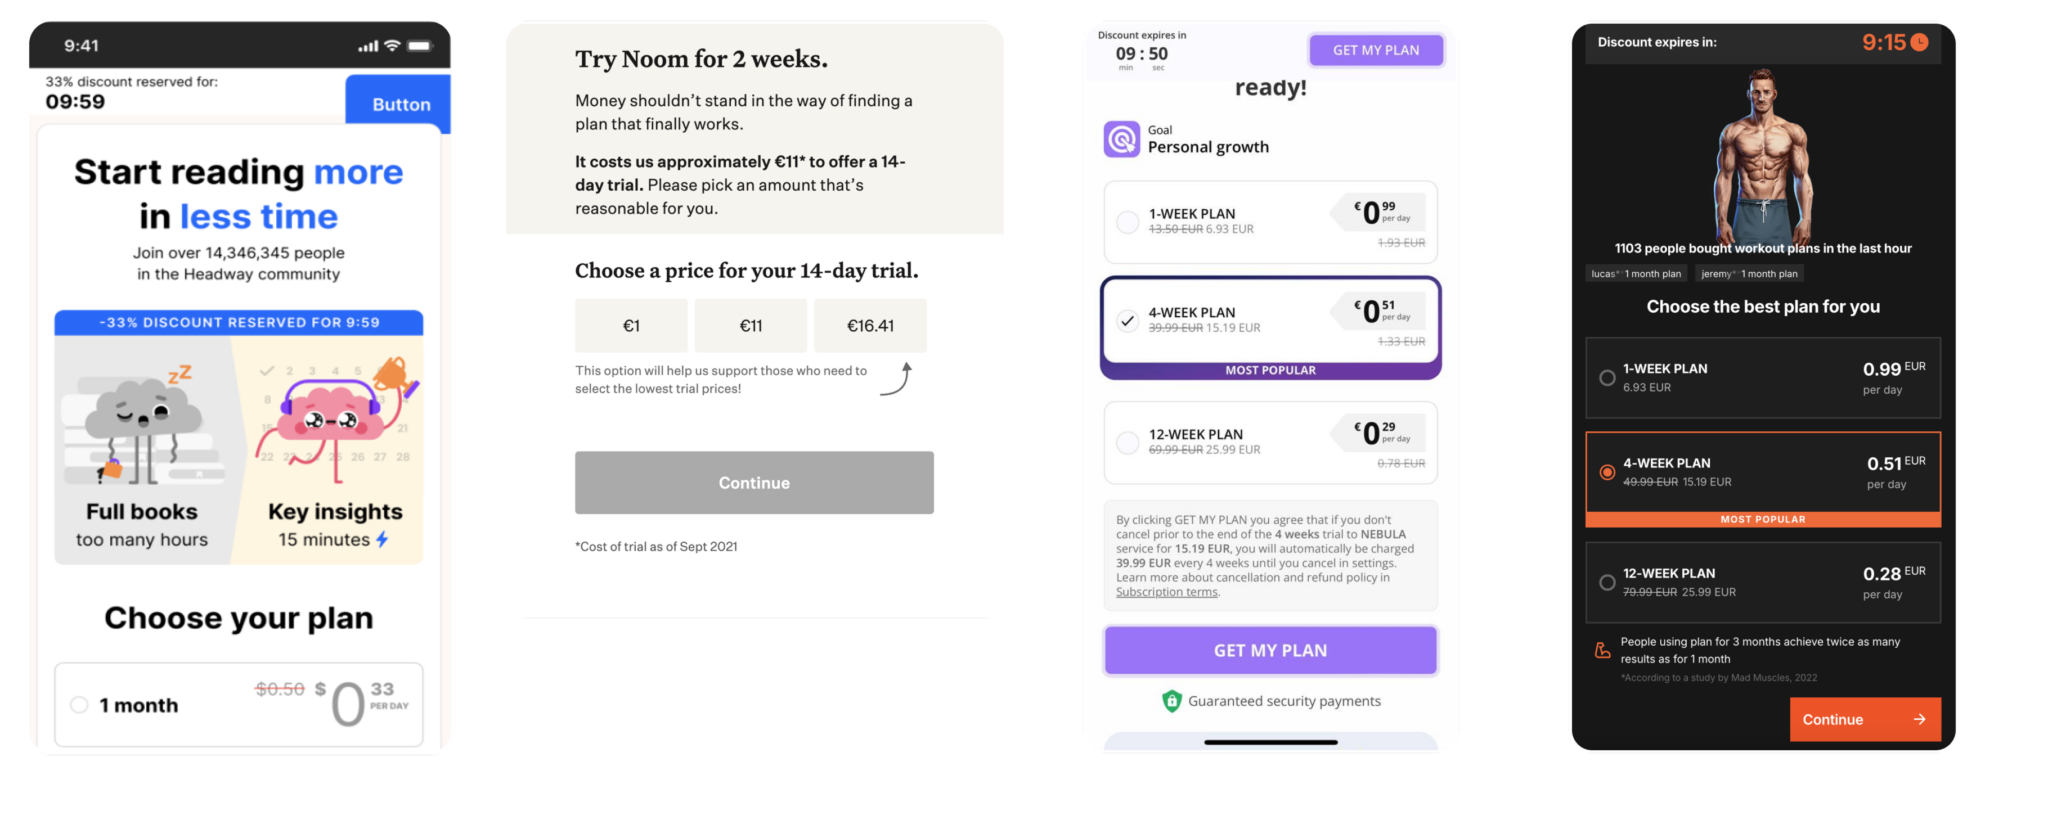
What to A/B test on the paywall?
Pricing strategy:
- Trial plans: paid trial vs. introductory offer vs. free trial
- Pricing models: e.g., monthly vs. quarterly vs. annual
- Full price vs. price for day/week/month
- Trials vs subscriptions
- Winback offers
UI & UX:
- Layout & structure: number of pricing options, their placement and order
- Pre-selected plans
- Personalization
- FOMO and urgency triggers
- Social proof
- CTA
- Plans naming
What to A/B test on the checkout?
- Checkout placement: separate screen vs. modal window vs. directly on the paywall
- Payment methods: Apple Pay, PayPal, cards, Google Pay, etc.
- Default payment method
- Security & contact info (payment security badges, support details, refund policies)
- Money-back guarantee
↘ Learn how to set up an effective payment flow in your web-to-app funnel
How to organize effective A/B testing process
Follow these steps to ensure that the experiments are well-prepared, executed efficiently, and analyzed for insights that can inform future hypotheses and strategies.
1. Involve the team
First, start by involving the team, as A/B testing is a team effort, not one person’s responsibility. Here’s how to make it work:
- Immerse the team in context. Everyone involved should understand the goals, metrics, and test results.
- Treat designers and PMs as marketers. Design choices affect conversion as much as copy and pricing. Product managers control key funnel elements. When these teams think in terms of impact, results improve.
- Involve them in hypothesis generation and prioritization. The best testing ideas don’t just come from marketing. Designers, PMs, and analysts bring unique insights and valid hypotheses.
2. Generate hypotheses
The best ideas come from competitive research, analytics, user insights, and external advising.
3. Prioritize high-impact hypotheses
The most common prioritization frameworks are ICE and RICE. The specific framework doesn’t matter, what is important is to set a clear system to evaluate and rank hypotheses.
Let’s take the ICE framework — here’s how it helps assess hypotheses based on three key factors:
- Impact. How big is the potential effect on the KPI?
- Confidence. How certain are we that this idea will work?
- Ease. How difficult is it to implement?
Each factor is scored, and the total ICE Score (ranging from 3 to 30) helps prioritize which hypotheses to test first. Higher scores indicate ideas with strong potential and lower execution effort — these will be your top candidates for A/B testing.
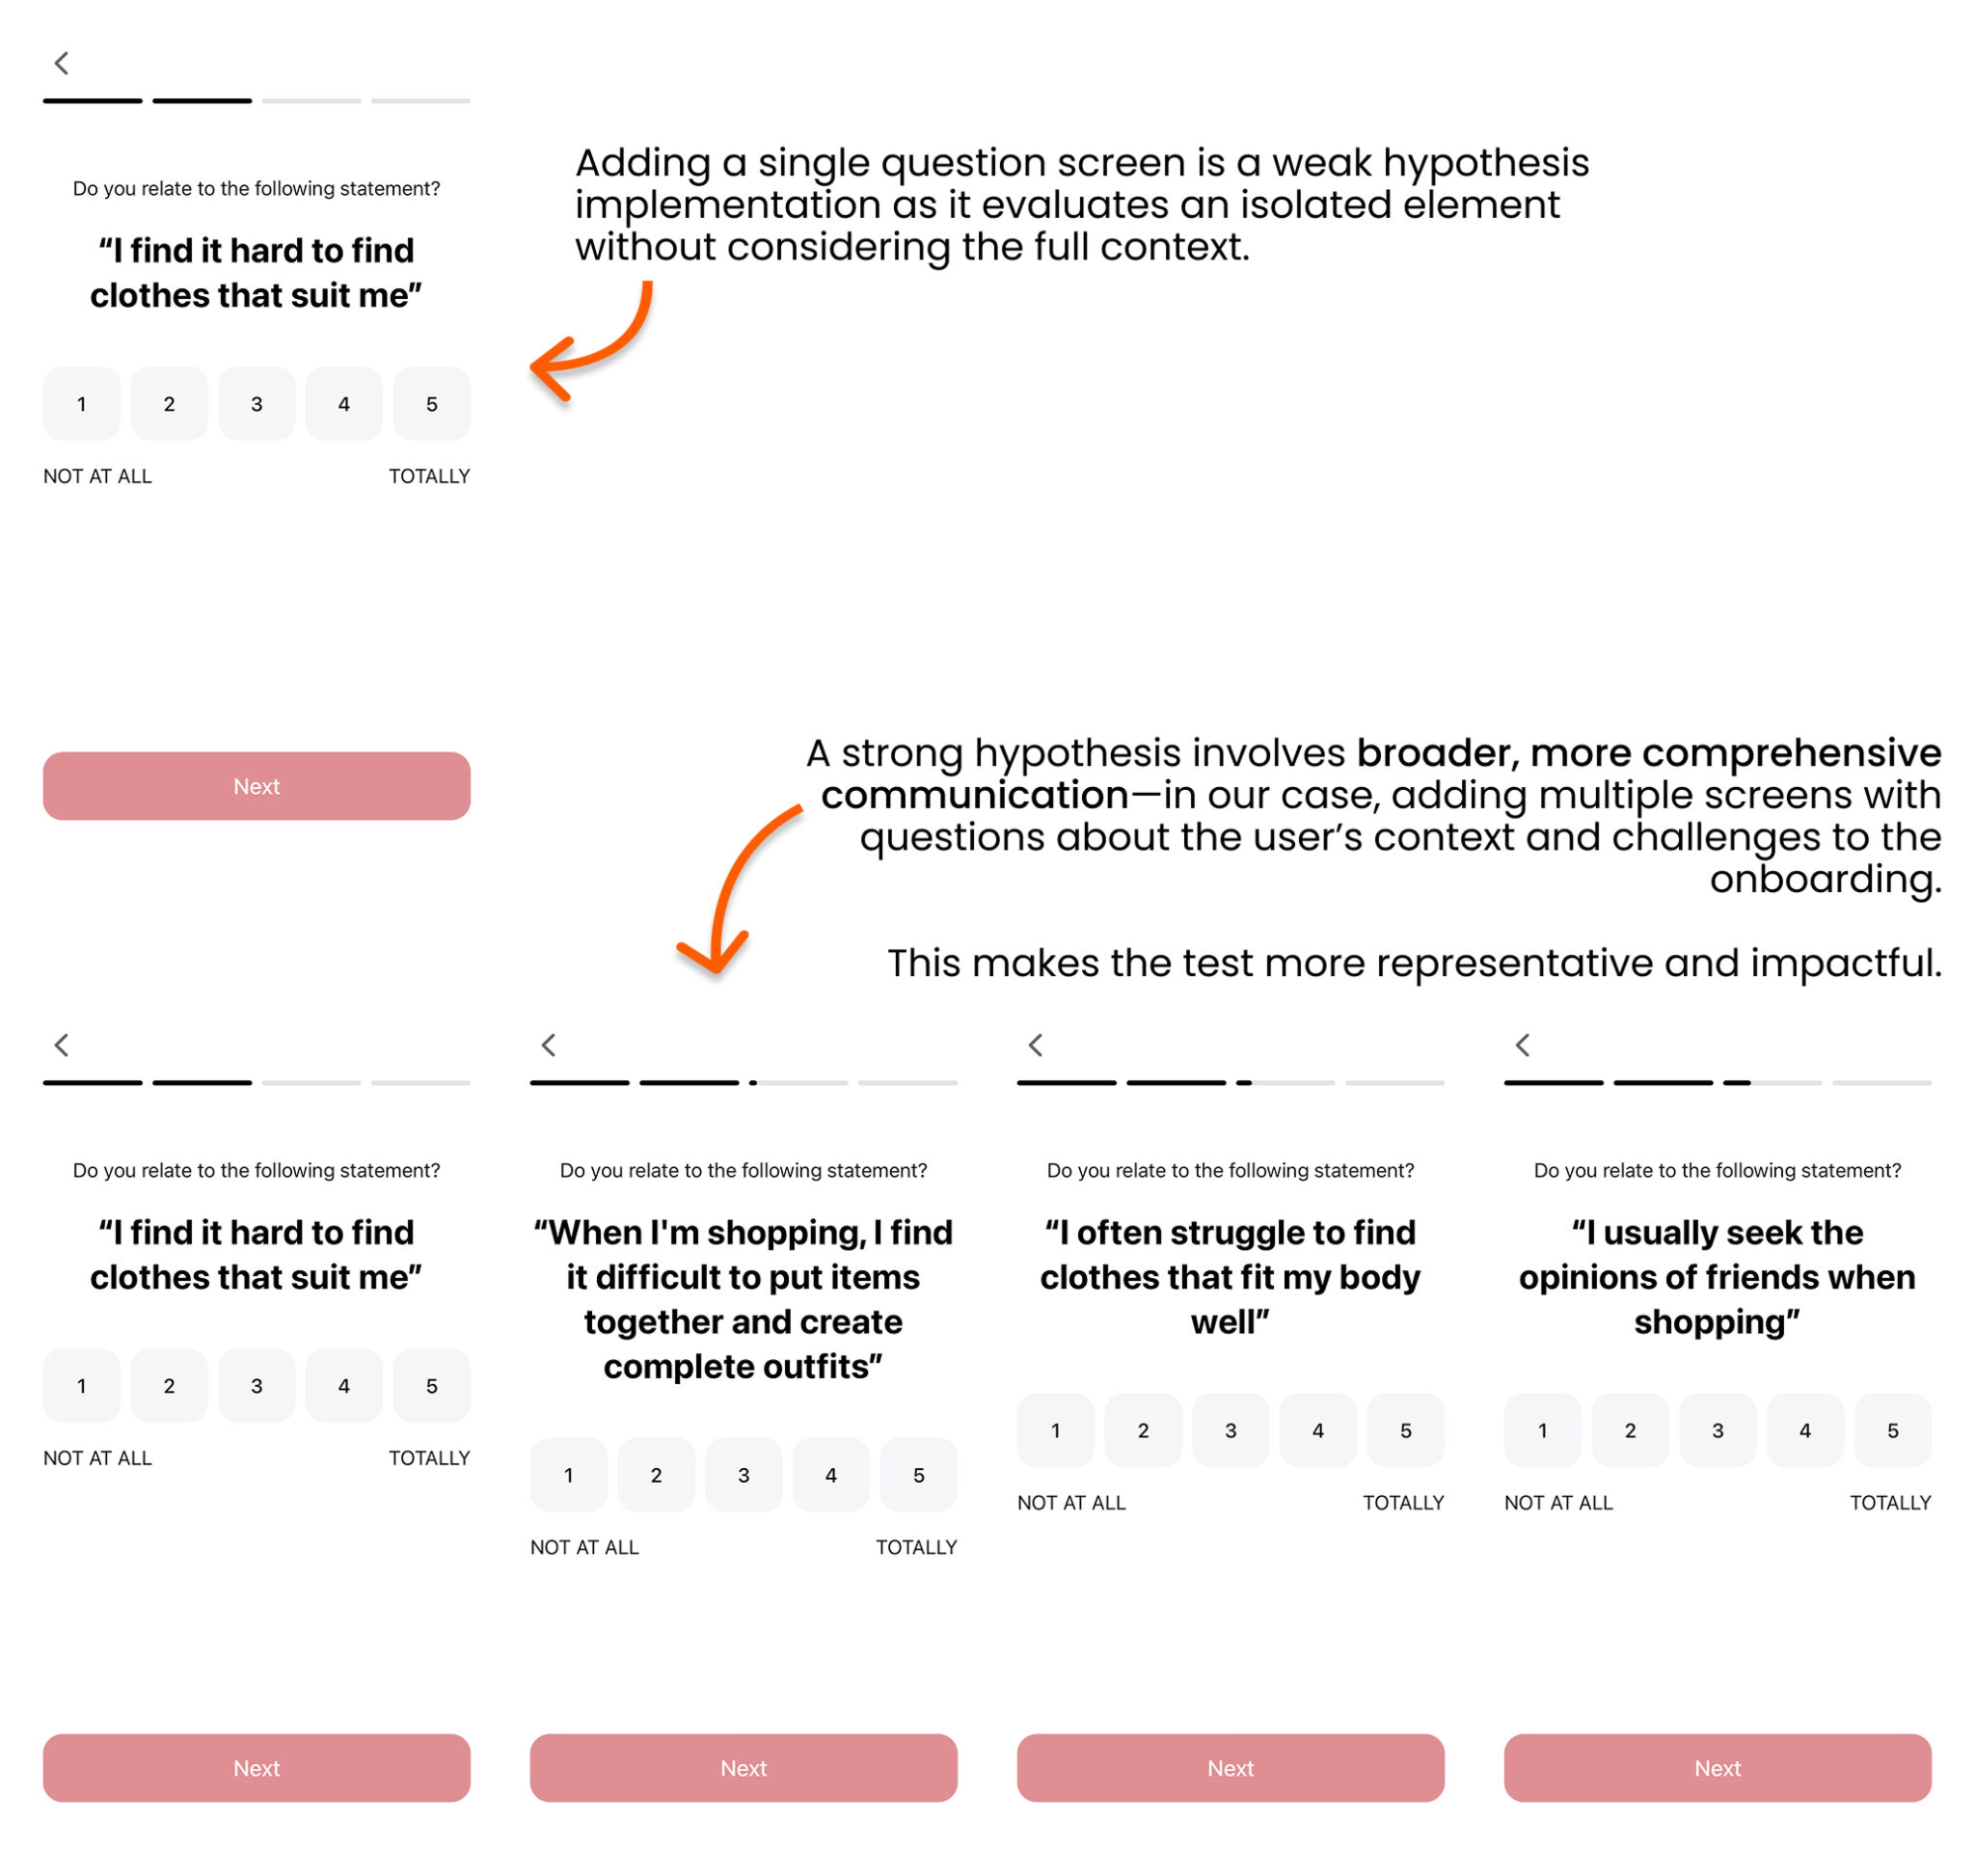
💡 How small of a change is worth testing?
It’s ineffective to test just one idea in isolation — you’re testing a hypothesis, which requires evaluating the messaging across multiple creatives and screens to get a full picture of its impact. Test just as much as is needed to validate the hypothesis (typically, it’s a multi-screen communication flow).
To get reliable results:
- Keep tests clean: one hypothesis, one change, one test.
- Split traffic at the step right before the change to prevent earlier behaviors from distorting results.
- When testing across multiple geos, segment US vs. non-US users to account for differences in conversion behavior.
4. Prepare and launch the experiment
4.1. Create a knowledge base
Outline a structured document containing sections for:
- Hypotheses. For example, offering a 2nd subscription at a reduced price could quickly increase revenue.
- Evidence. Highlights the evidence supporting the hypothesis.
- Expected impact. Specifies the metrics to measure the success of the hypothesis and its potential impact on KPIs like ARPU.
4.2. Design the test
A well-designed experiment ensures clear insights with speed execution and minimal resource waste. The goal is to test efficiently while gathering meaningful data.
- Cheap and straightforward tests. Use “fake doors” as the most aggressive approach to validate demand before full implementation.
- Define expected results. Clearly outline what success looks like and what the test is meant to reveal.
- Detailed design. If the experiment involves logic or multi-step interactions, include screen flow transitions to ensure smooth user navigation.
- Team alignment. Hold an introductory session with the team to align on goals, execution, and expected outcomes before launch.
4.3. Conduct the pre-launch check
Run a full funnel check in native browsers to catch any technical issues. Treat analytics as a separate functionality, ensuring all events are tracked correctly and data collection is clean.
4.4. Launch
If you’re testing across multiple channels, start with Meta. For high-traffic experiments, start small. Begin with 20% of traffic, analyze initial results, and gradually scale up.
4.5. Operational KPI and monitoring
The volume of tests run directly correlates with growth. Set a KPI for test volume and track how many experiments you launch in a specific period of time. Increase the win rate by prioritizing hypotheses that can drive 30%+ potential impact instead of small, incremental tests.
Regularly monitor the status of experiments and resource load, as well as the number of experiments launched and their success in various aspects.
With sufficient traffic, the following testing pace is recommended per product:
- 5 experiments per week (covering all stages: discovery, design, development, execution, analysis).
- Completed experiments:
- Per week — 1 fully completed test
- Per month — 4-5 completed tests
- Per quarter — 10-15 completed tests
💡 Use a web funnel builder to test and optimize faster: it allows running 3-4 experiments per week, scaling to 12-16 per month.
5. Assess results
A/B tests should be assessed by their impact on revenue, not metrics like clicks or engagement. If a test improves CR but lowers ARPU, it might look like a win, but it’s actually losing money. Always optimize for revenue impact, not just immediate conversions.
Primary metric:
- ARPU — the final metric that determines whether a test was successful
Secondary metrics:
- CR — helps measure the immediate impact of changes
- ARPPU — useful for pricing and monetization tests
- Cancellation Rate — indicates how pricing or offer changes affect churn and future revenue
- Refund Rate — helps identify how aggressive pricing strategies impact churn and immediate revenue
Benchmarks and tips for increasing test accuracy
For large-volume tests (high traffic & budget):
- Target 95-100% statistical significance
- Allocate $5K-$10K+ per variation
- Collect 300-500+ purchases per test before drawing conclusions
- Monitor cohorts over 3-6 months (especially relevant for pricing tests)
- Maintain a full seasonal cycle (7-14 days minimum)
- Track external variables: traffic shifts, auction fluctuations, and segment behavior changes
For small-volume tests (lower traffic & budget):
- Focus on bold, high-contrast hypotheses with 30%+ expected impact
- Collect at least 100 purchases per variation
- If a test shows <15% uplift, move on to the next experiment
- Track cohorts for 3-6 months
- Maintain a minimum 7-14 day testing period
- Watch for traffic changes — auction dynamics can skew test results if not controlled
💡 To ensure reliable results, use a statistical significance calculator to validate experiment outcomes before making decisions. You can find one here.
Do you really need to A/B test, or is it better to launch a new funnel?
Not every experiment needs an A/B test. Sometimes, a completely new funnel is the better choice. Let’s find out when to launch a new funnel and when to optimize with A/B testing.
Launch a new funnel when:
- Traffic volume is too low for statistically significant results
- You’re targeting a new audience segment (e.g., shifting from men to women or younger to older users)
- You’re testing a full copy of a competitor’s funnel
💡 Use a separate link, campaigns, and pixel for the new funnel, as if it were a first-time launch. Optimize ROAS.
Run an A/B test when:
- You already have enough traffic to measure results quickly
- You’re improving specific elements within an existing audience segment (e.g., a new pricing strategy, onboarding update, or paywall tweak)
Smarter way to A/B test your funnels
So, here’s how you launch tests that have the biggest impact on the key metrics:
- generate strong hypotheses based on real data
- prioritize based on the expected impact
- iterate quickly, test a lot, and scale what works
FunnelFox gives you a fast, no-code way to build, A/B test, and optimize every step of your funnel, from onboarding to paywalls and checkout. No waiting on developers, no guesswork — just quick iterations and funnel optimization backed by A/B tests.