


Onboarding is often treated as a UX step. But in web2app, onboarding sits inside monetization: payment conversion depends on what happens earlier in the flow, which makes onboarding a primary driver of funnel economics.
This article looks at onboarding as a revenue mechanism:
- where it tend to break,
- how to diagnose drop-offs,
- and which changes impact downstream metrics and funnel economics.
TL;DR
Onboarding funnel optimization is about building purchase intent and trust before the paywall. In web-to-app, small improvements early in the onboarding stage compound across the entire funnel and directly impact revenue.
Most conversion loss happens inside onboarding, not on the paywall. The main break points are message mismatch after the click, generic flows for different user intents, weak trust-building, and poor transition to pricing.
Track onboarding in stages: entry into the flow, screen-to-screen conversion, paywall reach, purchase conversion, and revenue per visitor. Diagnose drop-offs step by step and fix the specific mechanism that breaks.
Once structural issues are resolved, growth comes from controlled A/B testing focused on revenue impact, not individual screen metrics.
When optimized correctly, onboarding increases paywall reach and drives a disproportionate lift in subscription revenue.
What is an onboarding funnel?
In a web-to-app funnel, onboarding is the set of screens between the post-ad landing page and the paywall. Users complete it before installing the app.
Most often it takes the form of a quiz. Between questions, the flow shows progress states, social proof, and product facts to build trust and shape purchase intent before the paywall.
In-app onboarding starts after installation. Its role is different: help the user start using the product. It typically includes permission screens (notifications, tracking, access), goal or interest selection, a short introduction to key features, the first “aha” moment, and sometimes a soft paywall presented as part of usage rather than the peak of the onboarding flow.
Both stages are called onboarding, but they operate at different points of product economics and solve different problems:
| Web-to-app onboarding | In-app onboarding | |
|---|---|---|
| Traffic temperature | Cold ad traffic | Warm: user already installed |
| Primary goal | Create purchase intent | Help the user start using the product |
| Trust building | Prove value and expected outcome | Explain features and functionality |
| Monetization timing | Before app install | After activation or trial |
| Required persuasion intensity | High: user hasn’t invested yet | Lower: user already engaged |
| Strategic implications for subscription apps | Filtering and warming users before payment | Activation and retention |
On the web, onboarding funnel influences monetization far more directly than in the app. Most revenue loss begins at this stage.
How onboarding impacts paywall conversion and subscription revenue
Onboarding optimization doesn’t increase purchases directly, but it increases the number of people who reach the decision point, so even a small improvement early in the flow scales across the entire funnel.
According to FunnelFox’s State of Web2App report, about 13% of users reach the paywall and roughly 3% of sessions end in a purchase. This implies a paywall conversion of about 23%, but only among users who reach it.
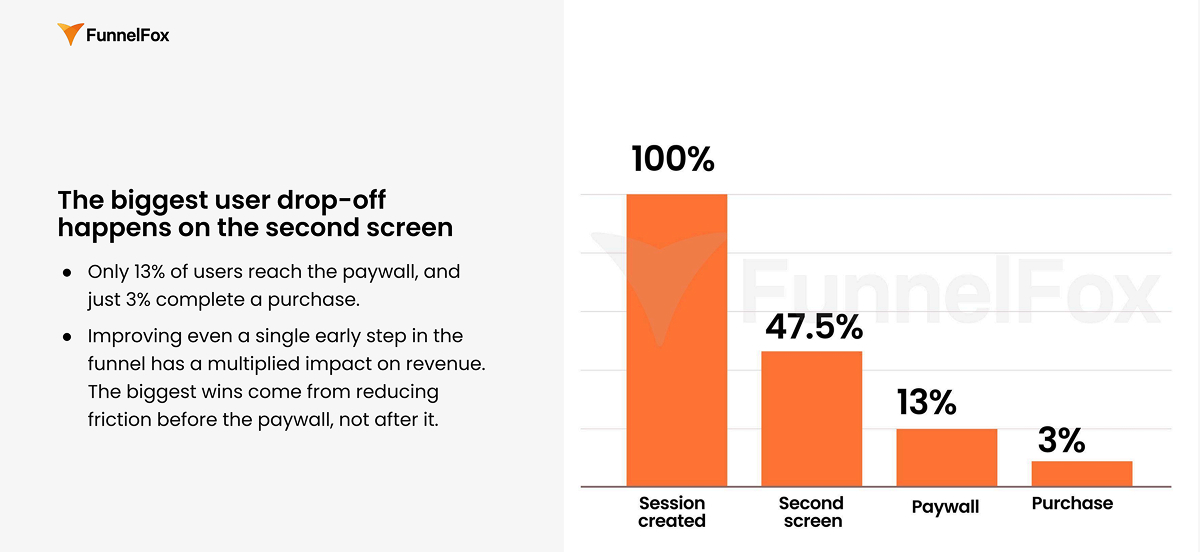
Take 10,000 clicks: around 1,300 users reach the paywall and about 300 purchase. With an AOV of $50, that equals $15,000 in revenue.
Now improve onboarding and raise paywall reach from 13% to 16%: about 1,600 users reach the paywall. At the same 23% conversion, roughly 369 users purchase, and revenue becomes $18,450.
A 3% increase in paywall reach produces a 23% revenue lift. Small gains early in the flow create disproportionate financial impact because they multiply across the funnel.
This compounding effect means a single onboarding change influences the entire funnel economy.
Onboarding also indirectly affects user LTV. The earlier users commit, the higher their long-term value: they choose longer plans, cancel less often, and generate more predictable revenue.
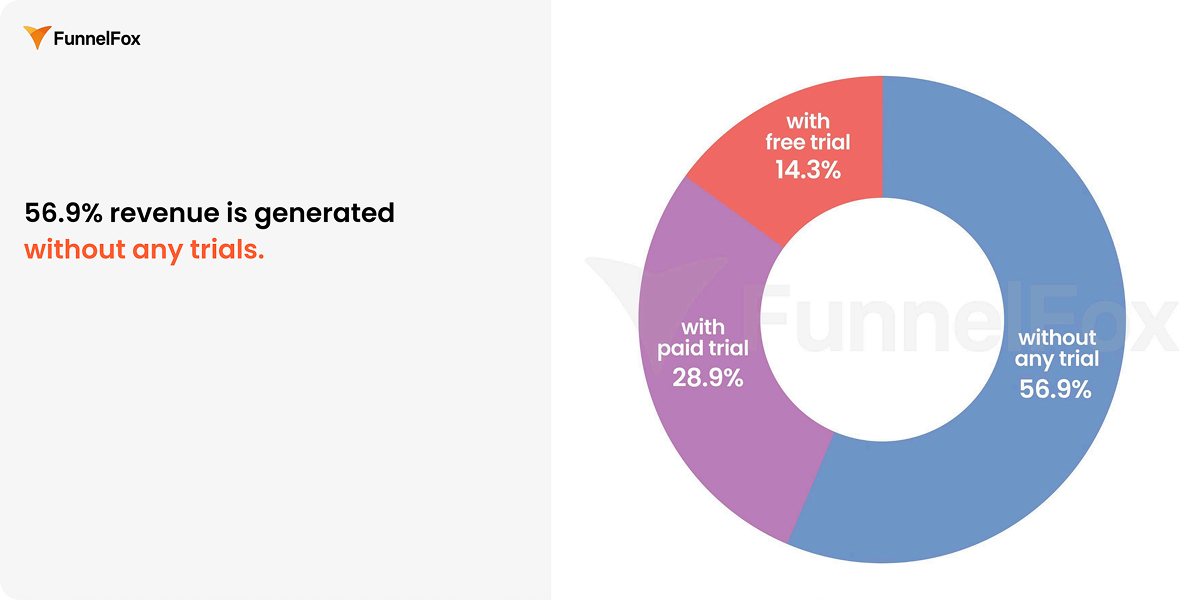
That’s exactly what onboarding aims to do in web-to-app funnels — drive upfront payment. And in web2app, upfront payments without any trial drive 56.9% of total revenue.
Common onboarding conversion leak points
The largest drop typically happens right after the first screen, with only 47.5% reaching the second screen. That’s expected — early steps filter out accidental clicks and irrelevant traffic.
Further down the funnel, the nature of drop-offs changes. If a user passes the first screen, they’ve already confirmed basic relevance, and at that point, low post-click conversion is no longer about curiosity or random clicks on your ad. They come from the onboarding logic itself.
Let’s explore the points where onboarding funnel most often breaks.
Message mismatch between the ad and the first screen
Users arrive with a specific expectation shaped by the ad and decide within seconds whether it matches what they see. If the first screen doesn’t continue the promise of the creative, relevant users leave before the onboarding even begins.
One onboarding flow for multiple user intents
Each creative brings users with a different expectation. When all of them are pushed into the same universal flow after the first step, it no longer continues their motivation and becomes average for everyone.
So the goal isn’t just matching the first screen to the ad, but building separate funnels for key ad angles. Onboarding funnel must develop the same logic that triggered the click, otherwise interest fades before the paywall.
BetterMe, a large fitness app, gets this right. They run dozens of onboarding funnels for the same product, each tailored to a specific segment: men, women, older users, beginners, weight loss, muscle gain, and more.

Weak trust-building before paywall
In web flows, users often encounter the product for the first time, so trust has to be built progressively throughout the onboarding funnel.
Introduce trust signals between questions: social proof, facts, micro-results, and personalized takeaways. These screens reward effort, increase confidence in the product, and gradually position both the problem and the subscription as the solution.
Poor transition from onboarding funnel to paywall
After a series of questions, showing a paywall immediately rarely converts. The flow needs a transition: analyze and interpret the user’s answers, reflect their goals back to them, and present an outcome, for example a plan framed as built specifically for them. The paywall then feels like unlocking something the user already perceives as theirs.
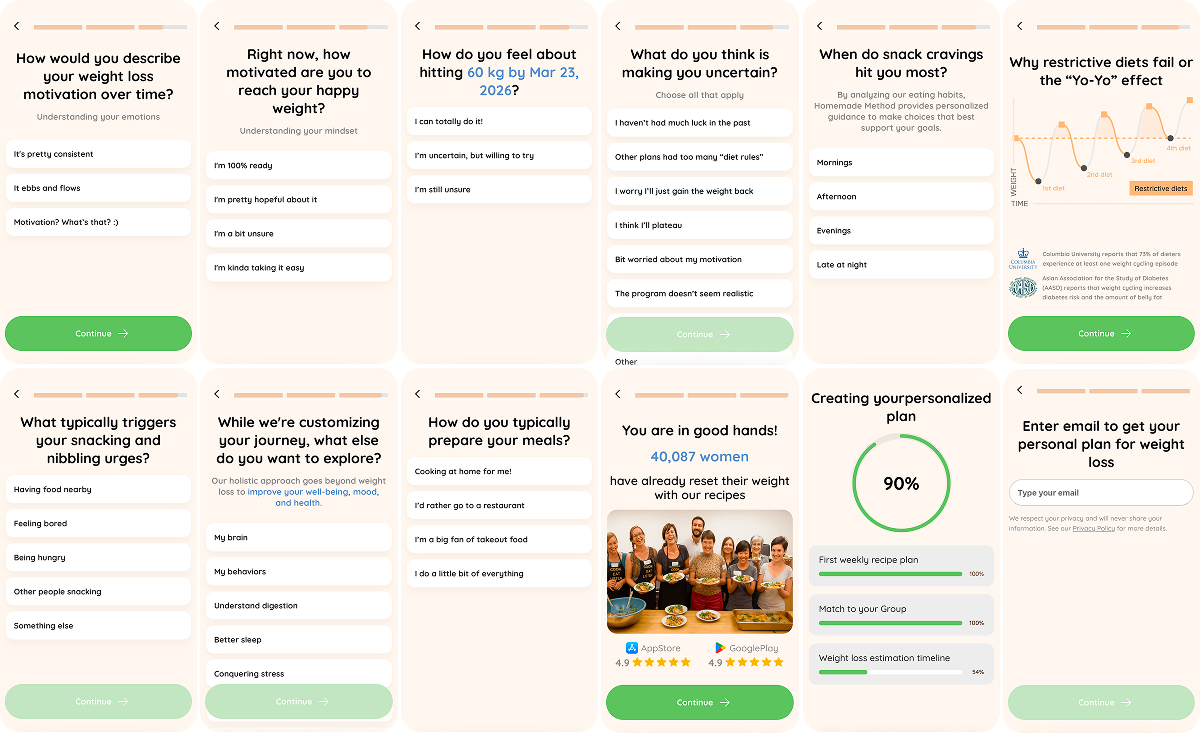
A good example is Homemade Method, a meal prep app: first a sense of belonging (“people like you”), then the plan takes shape, and only after that come account creation and payment. The user experiences it as a continuation of a process already in motion.
It’s easy to name these issues. Spotting them in a real funnel requires looking at the data.
Key onboarding funnel metrics to track
Watch how users move through the flow
Start to second screen — indicates whether the first screen matches user expectations. If low, the issue is the entry point.
Step conversion (screen-to-screen) — compares each screen to the next and shows where interest drops. Used to locate the weak part of the flow: which step type causes the decline (question, fact, result, transition).
Drop-off per step — evaluates the same step in isolation and checks consistency. If the drop repeats across segments and time, the step itself is the problem. If it fluctuates, it’s likely noise or traffic quality.
Onboarding completion rate — shows how many users finish onboarding. Reflects friction: length, clarity, and step difficulty. Interpret only together with paywall reach, since high completion may also indicate weak filtering.
Paywall reach (from start) — shows how many incoming users reach the paywall.
In a simple linear funnel completion rates and paywall reach may look identical. In real web-to-app flows they diverge: users reload sessions, return from retargeting, land mid-flow, or skip steps. Completion tells you the flow is passable; paywall reach tells you the flow brings cold users to the point of evaluating the price.
Then check the money impact
Paywall to purchase conversion — compares users who saw the price with those who paid. Indicates how well the paywall converts.
Start to purchase conversion — compares everyone who entered the flow with those who paid. Reflects the effectiveness of the entire funnel.
Revenue per visitor / per click — shows how much revenue each funnel variant generates per incoming user.
AOV impact — shows whether onboarding changes not only the likelihood of purchase but also its size. Deeper diagnostics and clearer value explanation often don’t increase the number of purchases, but shift users toward higher-priced plans or longer subscriptions, raising revenue at the same purchase conversion.
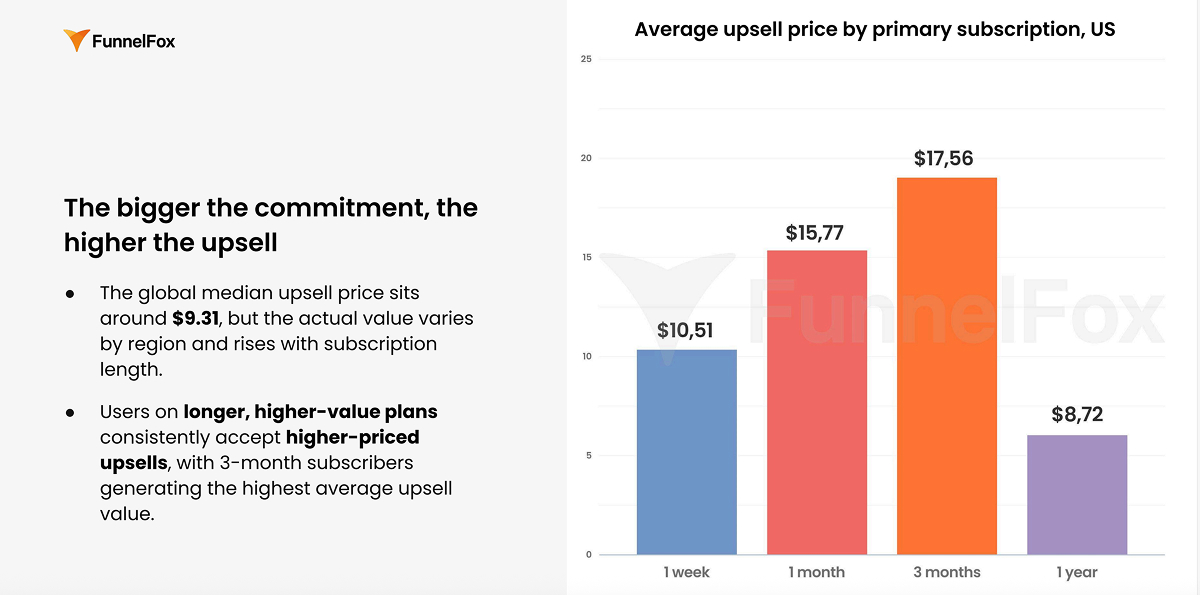
Tip: Higher initial subscription prices often allow for larger post-purchase upsells.
Users who choose a premium or long-term plan have already signaled strong intent and willingness to pay, so they’re more likely to accept additional offers. In this case, the upsell works as a natural extension of the decision rather than extra pressure, and can significantly increase LTV.
Once you’re tracking these metrics, the next step is using them to pinpoint the actual cause of the drop.
How to diagnose onboarding funnel drop-off
Metrics alone don’t explain much. The absolute number matters less than where the deviation begins and how it affects the next step. Below is the order used to identify the cause of onboarding drop-offs.
1. Find where the break starts
Look at step conversion and find the first sharp drop — that’s usually what knocks the rest of the funnel off course.
2. Understand who drops off
Analyze the same step across segments: source, creative, device, geo.
- If only part of the traffic drops, the expectation set by the ad doesn’t match the screen.
- If every segment drops in the same place, the issue lies in the screen itself.
3. Check the effort-to-value balance
Compare the surrounding steps and how the drop changes. A spike after a long question sequence suggests the flow asks for more effort than it returns. A drop after a result screen indicates insufficient value or trust to continue.
4. Check the impact on funnel economics
Evaluate changes through revenue, not intermediate rates.
If more users reach the paywall after an update but revenue falls, the flow has started filtering the wrong audience. The funnel appears healthier, but the business outcome is worse.
Onboarding funnel optimization strategies
Once the drop is located, avoid changing “the UX” broadly. Address the specific reason users leave: expectation, effort, trust, or the decision moment.
Here are changes that directly improve paywall reach and payment.
Keep cognitive load low until users are invested
The start should feel effortless: a tap, agreement with a statement, a short multiple-choice question. The goal is immediate forward movement.
As engagement builds, the flow can gradually become more demanding. Until then, onboarding should minimize friction and create a sense of easy progress.
Align onboarding with the ad promise
Onboarding should feel like a continuation of the ad. Users arrive with a specific expectation, and the first steps must confirm they are still in the same scenario. Keep the message, visual cues, and promise consistent with the creative so the user feels they are moving toward the expected result.
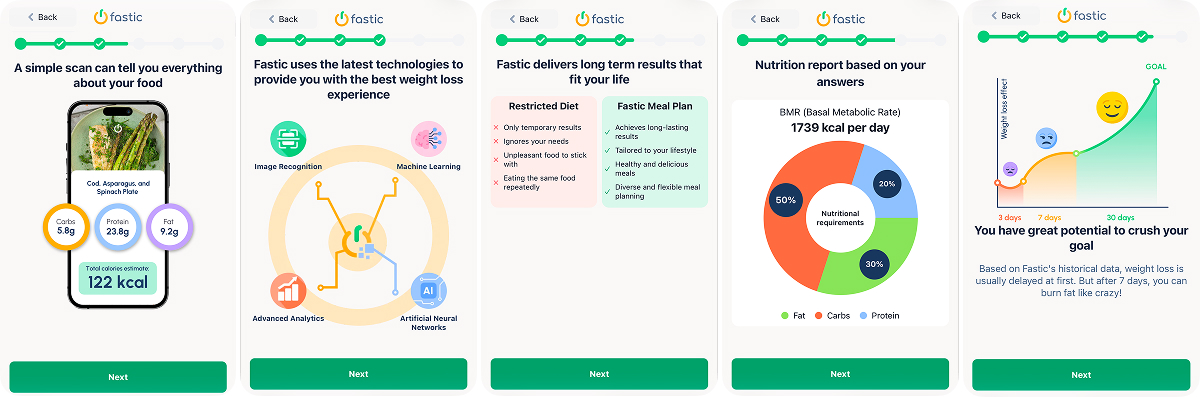
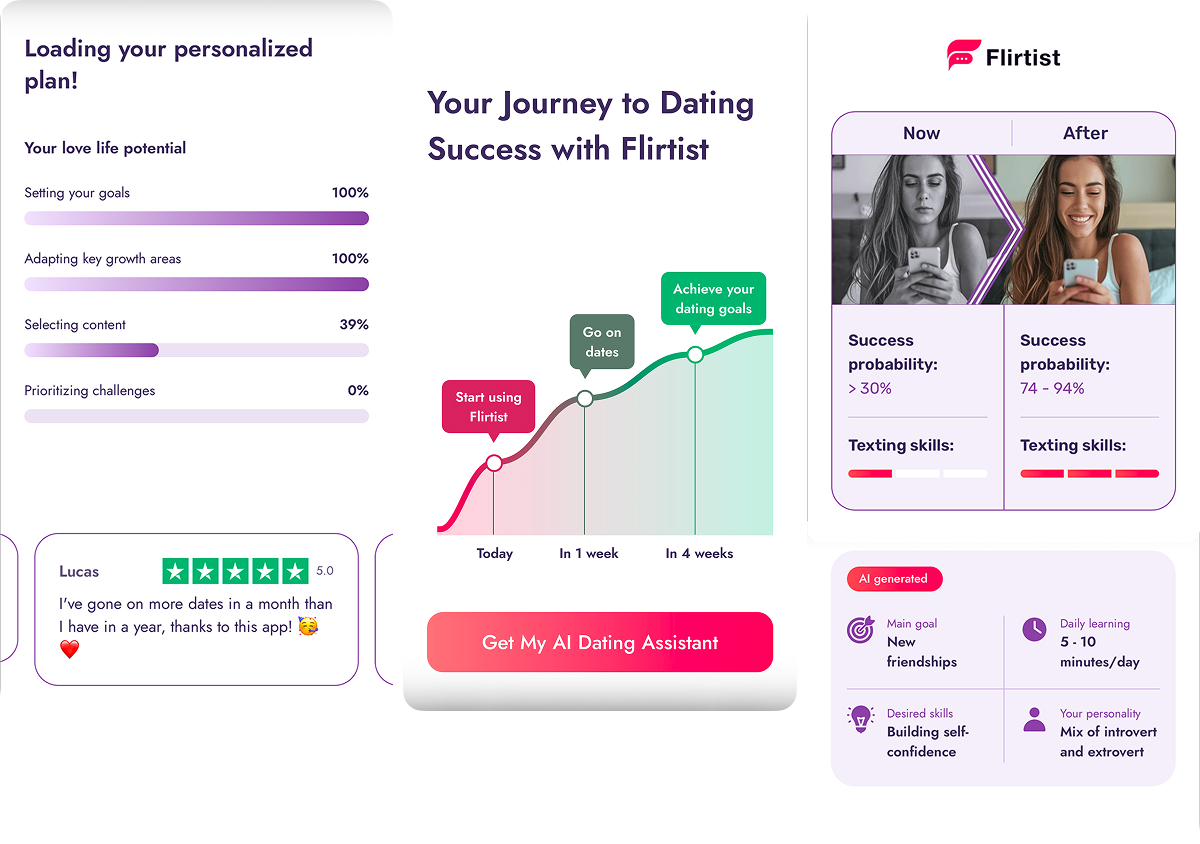
Add a value sneak peek
As users move through the onboarding funnel, provide small outcomes along the way: an insight, a prediction, a plan preview, or an assessment based on their answers. This works as a sample and proves their answers are being considered.
These inserts give a break from questions, strengthen personalization, and build anticipation for the final result. Plus, the earlier the user experiences the value, the more likely they are to continue.
Optimize the transition to paywall
For the paywall to feel like a natural next step, it needs a bridge. Before pricing appears, summarize the user’s answers and show the plan taking shape: recommendations forming, progress outlined, outcome previewed.
Tip: Paywall bridge is a good point to collect email.
By this point, the user has invested time and expects a result, so sharing contact details feels natural. And even if they don’t buy immediately, you now have a way to retarget and convert later.
Make it engaging
Even high-intent users get tired of repetitive screens. Progress bars and loaders show movement, but the key points are short, meaningful takeaways based on the answers: detected type, explained cause, expected outcome. They create small “aha” moments, where the user recognizes themselves in the result and wants to continue, and micro-results act as rewards for each step and help hold attention in longer flows.
Onboarding funnel example: Real app breakdown
Let’s look at how top apps design onboarding funnels using Calm as an example. Calm is one of the largest meditation and sleep apps. In this category, users don’t trust you instantly, so onboarding funnel needs time to build it. That’s why longer flows work here.
Reducing cognitive load at the start
The first screens require minimal effort. They help users recognize their state and ask a simple question, lowering resistance and creating a natural entry point.
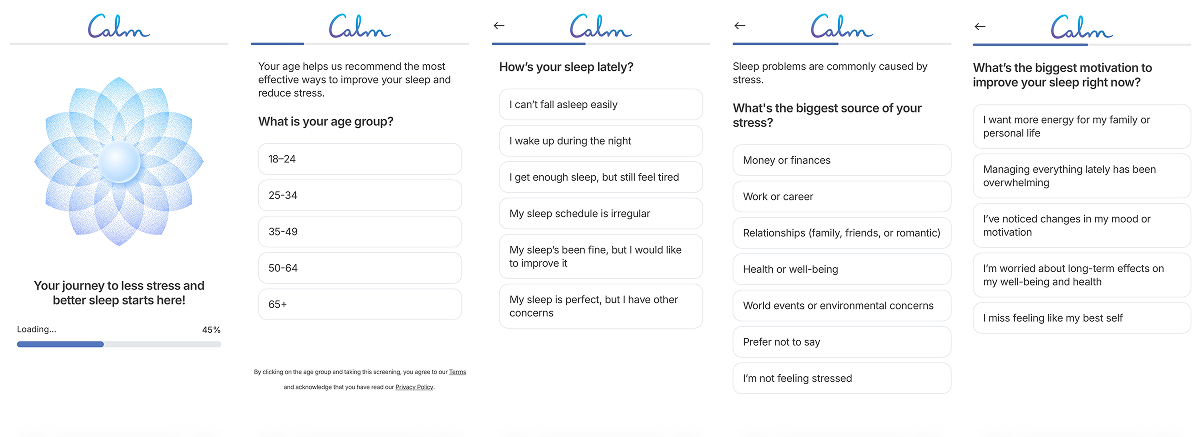
Building trust along the flow
Questions alternate with supportive copy and social cues. The flow shifts from a questionnaire to guided interaction, allowing more personal questions without increasing drop-off.
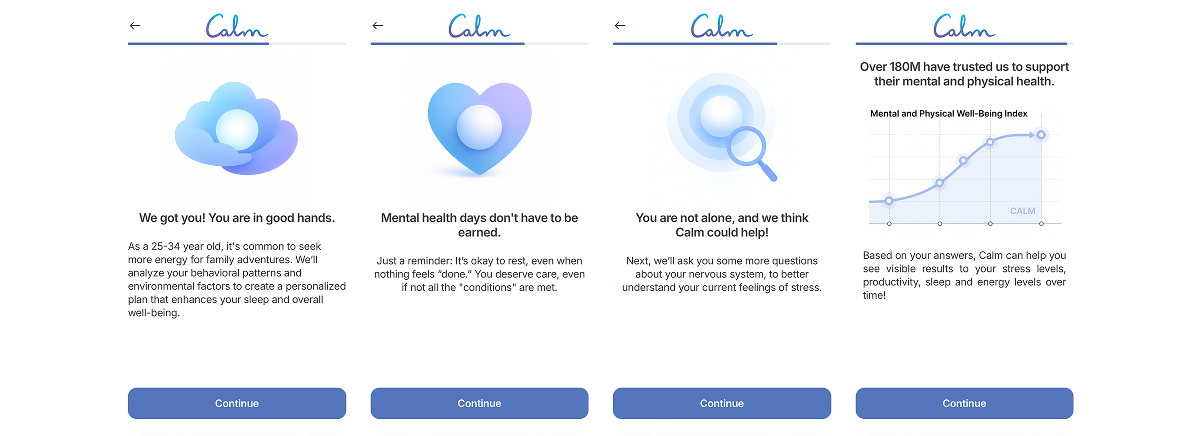
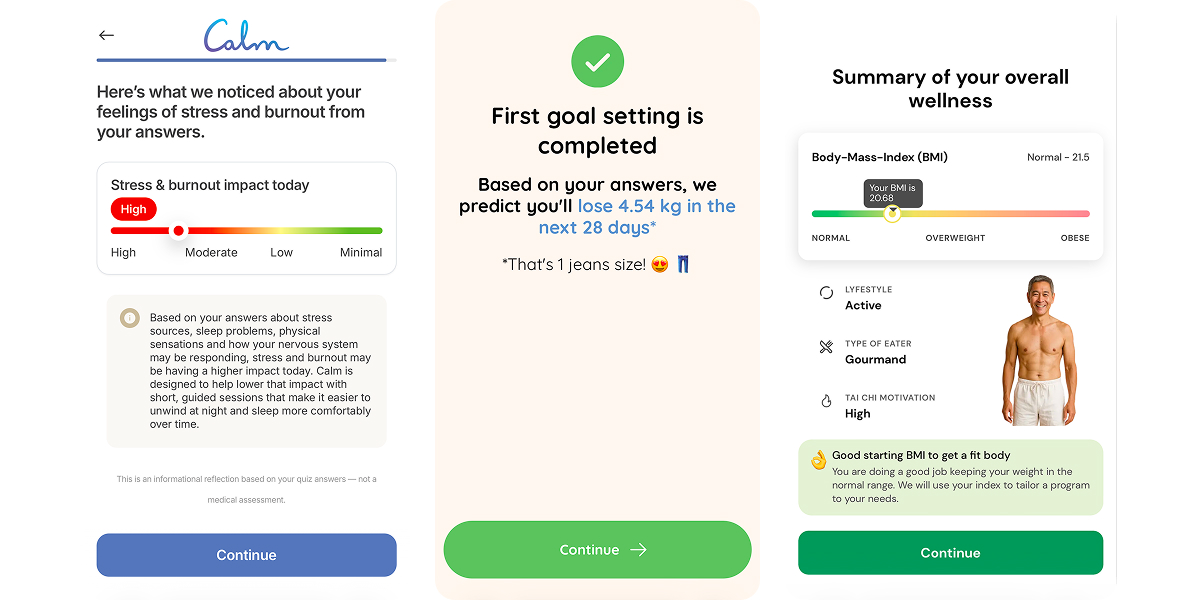
Value sneak peek and micro-results
Midway through the flow, Calm labels the user’s state and explains it through the nervous system. This small outcome changes perception: answers are being interpreted, not just collected.
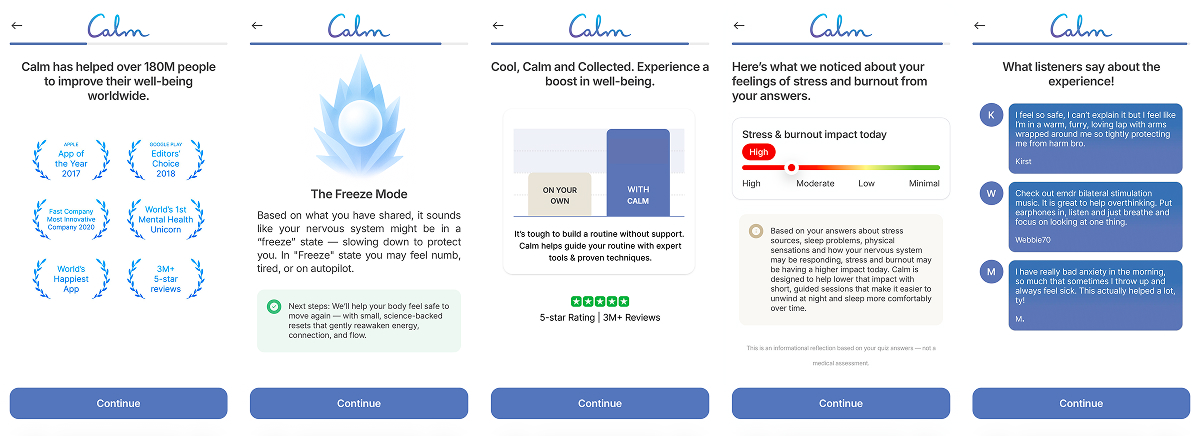
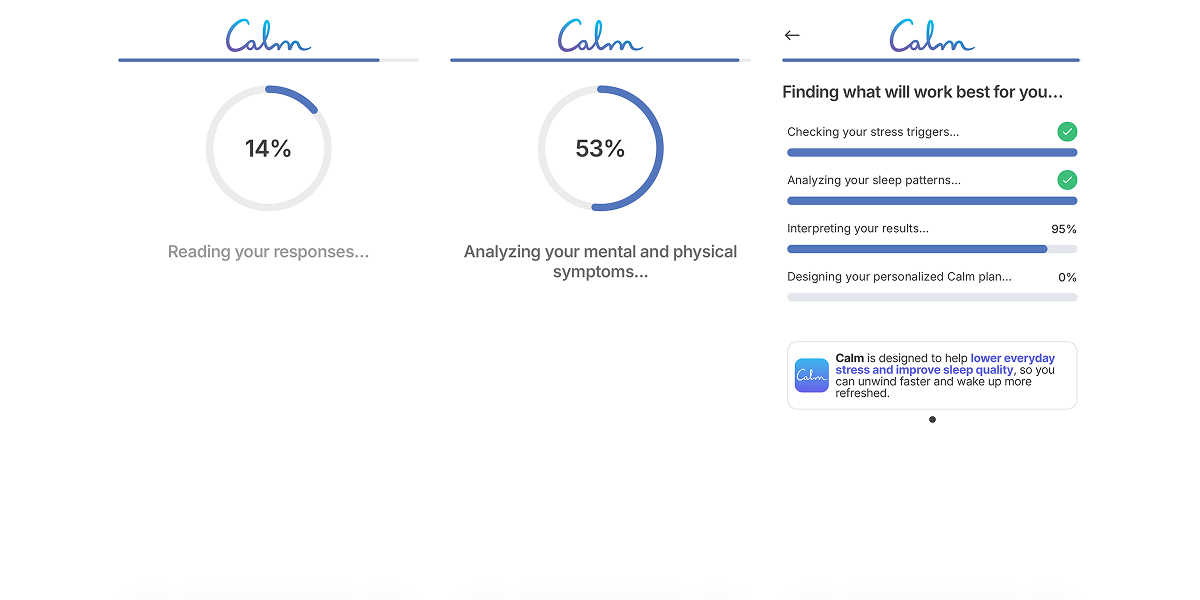
Engagement and commitment
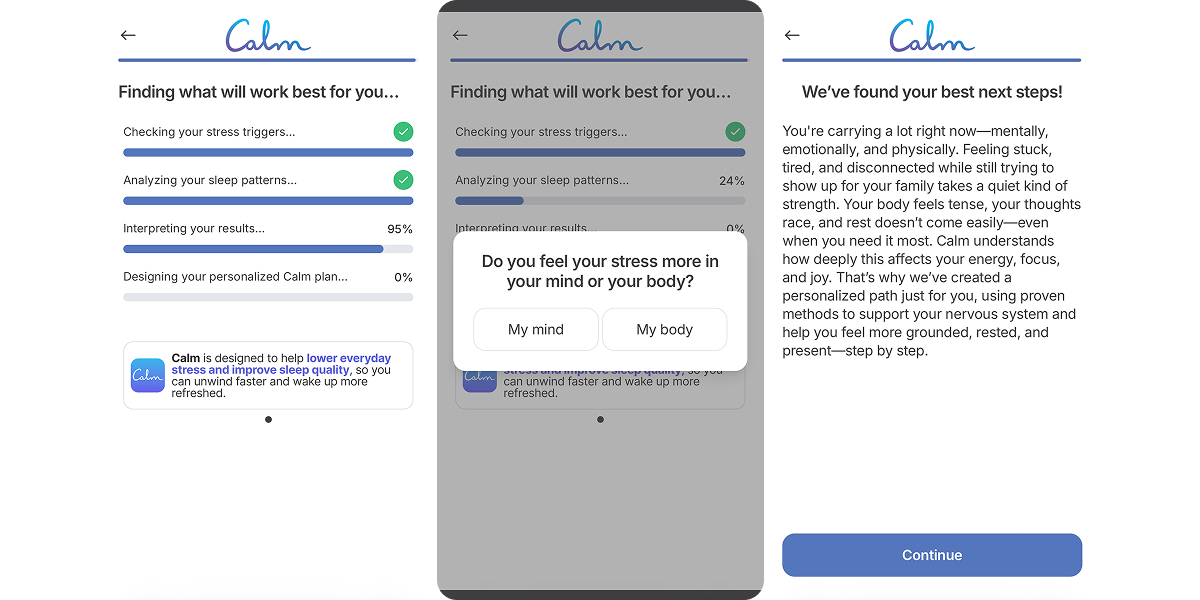
The long quiz acts as an effort investment. As users move through it, they begin expecting a final conclusion, while progress moments like “analyzing responses” and “building your plan” reinforce a sense of movement.
Transition to the paywall
Before the paywall, Calm consolidates the experience into a coherent explanation and presents a concrete plan. At this point, the user sees both the problem and the prepared solution, so the subscription feels like finishing something already in progress.
Onboarding funnel A/B testing framework
When funnel performance is consistent, further growth comes from controlled experiments.
The goal of A/B tests in onboarding funnels is to assess how certain changes impact revenue, not individual screen conversion. Here’s how you do it.
1. Run clean experiments
Each test should isolate a single hypothesis and a single change.
Split traffic right before the modified step so behavior on earlier screens doesn’t distort the outcome.
2. Always measure downstream revenue impact
Evaluate changes through revenue. If intermediate metrics increase but revenue doesn’t, the improvement is cosmetic.
Every hypothesis should be judged by one question: how does this affect revenue?
Avoid false positives
Sometimes a “winner” appears in an A/B test because of noise, not a real effect. Metrics naturally fluctuate because traffic mix can change day to day, user behavior varies, or purchases don’t happen evenly.
To separate signal from randomness, rely on statistical significance. A common threshold is 5% (p-value < 0.05), meaning the probability that the observed difference happened by chance is under 5%.
In FunnelFox, statistical significance and p-values are built directly into A/B tests, so you can get reliable results without extra effort.
A common mistake is stopping a test during a temporary spike. Early results often swing and disappear after rollout. Real improvements behave differently: the lift is smaller but stable and persists over time. Treat a test as successful only when the gain holds and translates into revenue.
What to actually test (and in what order)
- Start with entry into the scenario — test the first screen: wording, visuals, and interaction. It should confirm post-click expectations and set context for the rest of the flow.
- Test storytelling — compare direct vs aspirational messaging, longer explanations vs concise ones, social proof vs feature-led narratives, etc.
- Experiment with feedback loops — micro-results, answer-level comments, and warming elements that show the funnel understood the user.
- Introduce positive friction — email capture, photo, palm scan, or similar inputs. These increase investment and often improve conversion.
- Only after that, test onboarding funnel length — fast flow vs. deeper flow. The number of screens itself means nothing; what matters is the role it plays in forming the purchase decision.
Tools for building and optimizing onboarding funnels
There are two approaches: assemble the infrastructure in-house or use a dedicated funnel builder.
Building onboarding funnels in-house
If you build an onboarding funnel in-house, you own everything: designing the screens, coding them, and implementing the logic behind the flow.
Then you still need to add step analytics and experimentation as separate layers.
A typical setup looks like:
- web frontend for the flow
- analytics tools to analyze drop-off in onboarding (GA4, Amplitude, Mixpanel, Heap)
- experimentation tools (GrowthBook, VWO, Optimizely, Firebase Remote Config)
The trade-off is iteration speed and resourcing: even a small change pulls in design and engineering. In practice, getting a solid funnel live takes months, and every iteration keeps engineers in the loop.
Using a dedicated onboarding funnel builder
In web-to-app, growth depends on experimentation speed. For that reason, many teams use builders such as FunnelFox instead of hand-coding funnels.
With FunnelFox, teams can:
- Launch high-converting flows in an hour. You can build onboarding funnels from scratch or using templates designed around proven patterns and high-converting mechanics.
- See exactly where revenue is won or lost. Screen-level conversion, first sharp drop, traffic segments, paywall reach, purchase conversion, revenue per visitor, and AOV impact are tracked in one place. Instead of guessing, you see precisely where the funnel performs, where it breaks, and what to fix.
- Optimize based on statistically reliable A/B results. Experiments include p-values and statistical significance by default so you can trust the outcome and make decisions without reacting to short-term metric swings.
If you want faster iteration, clear visibility into conversion and revenue, and decisions backed by real data, book a demo to see how FunnelFox can support your goals.
Wrap-up on onboarding funnels optimization
The real shift in funnel economics happens when onboarding is approached like a revenue mechanism. Early steps determine who reaches the paywall and in what state, and though the onboarding flow’s impact on conversion rates is rarely visible at a single step, it compounds across the entire funnel. So the task isn’t to polish individual screens, but to manage how intent, trust, and value are formed before the decision point.