


Data doesn’t mean much if it doesn’t help you grow revenue. That’s the challenge with mobile app analytics: you have conversion rates, retention curves, and user counts scattered across dashboards, but connecting those numbers to actual business outcomes? That’s where most teams get stuck.
For subscription apps, this problem runs deeper. Growth depends on what happens after acquisition—whether users convert from trial to paid, how long they stay subscribed, and what drives them to upgrade or churn. Traditional analytics barely scratch the surface here.
In this guide, we’ll show you how to approach mobile app analytics with a revenue-first lens. You’ll learn which metrics actually matter for subscription growth and how to analyze them through the right context.
Subscription conversion rate (CR)
Conversion rate is your most direct path to understanding monetization health. But tracking a single overall CR hides more than it reveals.
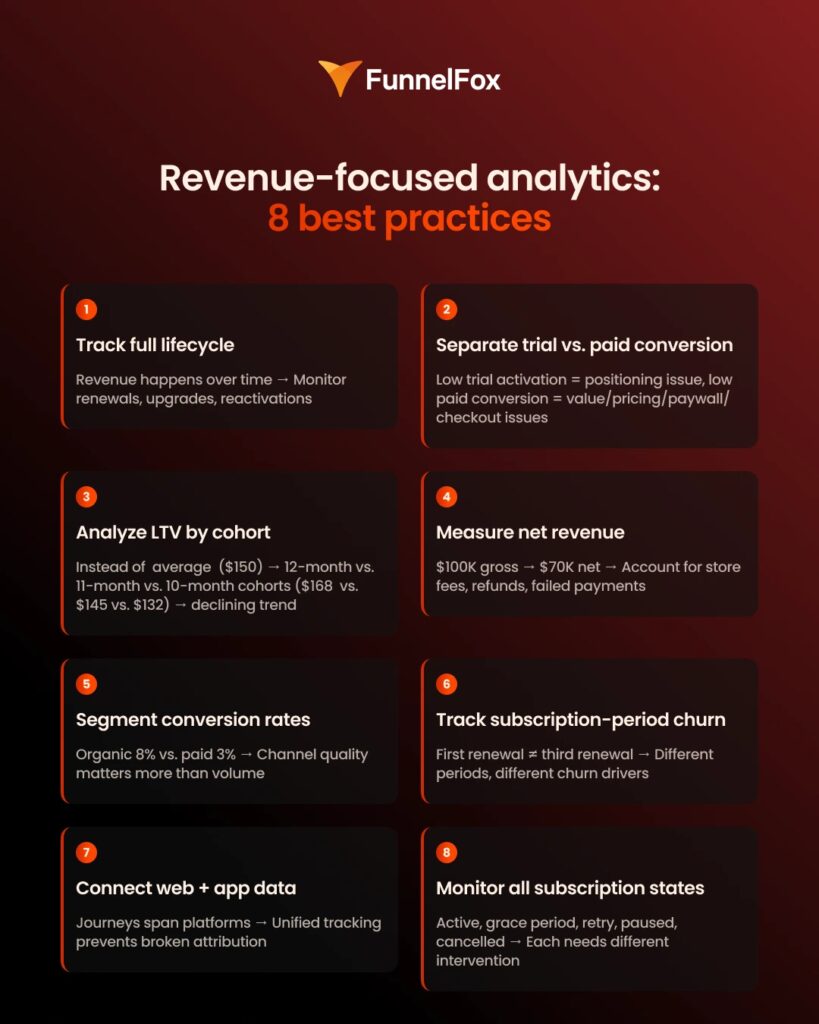
1. Track trial-to-paid separately from install-to-trial
Not all conversions carry the same weight. Install-to-trial activation shows top-of-funnel health—whether you’re attracting users who see enough value to opt in. Trial-to-paid conversion reveals actual monetization effectiveness: can you turn interest into revenue?
Separating these metrics helps you diagnose where the funnel breaks:
- Low install-to-trial? ➡️Your positioning or onboarding needs work.
- Low trial-to-paid? ➡️The paywall or pricing model might be the issue. Or maybe you’re simply not communicating the paid subscription value effectively.
2. Segment conversion by acquisition source
Not all installs convert equally. A 5% average install-to-paid conversion rate tells you nothing if organic users convert at 8% while paid ads bring 3%.
The math is straightforward: if organic costs $0 and converts at 8%, while paid ads cost $5 CPI and convert at 3%, you’re spending $167 per paid subscriber vs. $0 for organic. Even if paid volume is 10x higher, the unit economics tell a different story.
This way, channel-specific CR reveals the quality vs. volume tradeoff. You might be spending heavily on a source that drives installs but fails to monetize. Segmenting by acquisition source shows you where to double down and where to cut losses.
3. Analyze paywall drop-offs
Where users exit matters more than overall CR. A 4% conversion rate could mean strong interest with friction at checkout, or weak engagement that kills the funnel early.
Screen-by-screen funnel analysis reveals exactly where users hesitate. Are they dropping before the paywall? During plan selection? At payment entry?
| 💡FunnelFox tracks paywall performance for web2app flows, identifying exactly where users hesitate so you can test, iterate, and lift conversions systematically. |
Lifetime value (LTV)
LTV is the metric that ties everything together—but only if you calculate it correctly. Averages hide the trends that determine whether your subscription business is actually growing.
1. Calculate LTV by cohort, not averages
Averages hide the full story of your subscription business and doesn’t tell you whether your revenue quality is improving or declining over time.
Cohort analysis groups users by when they took a key action—typically when they installed your app or first subscribed. Each cohort is tracked independently over time, revealing how different groups perform as they age.
Example: Compare three monthly cohorts:
- January 2025 cohort: $168 average LTV after 12 months;
- February 2025 cohort: $145 average LTV after 11 months;
- March 2025 cohort: $132 average LTV after 10 months.
This reveals a declining LTV trend. You can investigate: Did acquisition quality drop? Did a product change in February hurt retention? Are newer pricing experiments underperforming?
Without cohort analysis, you’d just see overall LTV = $150 and miss that your most recent subscribers are worth 20% less than earlier ones.
However, time-based cohorts alone don’t tell you why performance differs. To understand what drives LTV variation, you need to layer in additional analysis—comparing how users with different characteristics perform within and across cohorts.
Build cohorts based on:
- Acquisition source (e.g., users who came from Facebook ads in March; organic installs in Q2);
- Geographic region (e.g., US subscribers who joined in January; EU subscribers from February);
- Purchase moment (e.g., users who subscribed during Black Friday; trial converters from Q4).
| 💡FunnelFox supports cohort analysis so you can track how each user group behaves after their first transaction—whether it’s a subscription, trial, or one-time payment. |

2. Update LTV as user behavior changes
LTV isn’t static. Product updates, pricing changes, and market shifts all affect retention curves. Recalculate quarterly to reflect current performance.
Using outdated LTV calculations leads to poor acquisition decisions—you might overpay for users who no longer deliver the same value, or underspend on channels that now convert better.
Retention and churn rate
1. Measure retention by subscription period, not calendar
Calendar-based retention (D7, D30, D90) works for engagement tracking, but subscription apps need to think in billing cycles. First renewal vs. third renewal—different churn drivers apply at each stage.
Use subscription-period cohorts for true retention patterns. This approach shows you when users are most likely to cancel relative to their subscription journey, not just calendar days since install.
2. Distinguish voluntary vs. involuntary churn
Involuntary churn happens when payments fail—not because users want to leave. These failed payments are recoverable through technical fixes:
- Smart retries: automated retry logic at optimal intervals;
- Card updates: proactive notifications when cards expire;
- Billing fixes: alternative payment methods, grace periods;
- Smart routing: route payments to different providers based on success rates (applicable for web2app flows).
Track them separately. Voluntary churn points to product or pricing issues. Involuntary churn is a technical problem with a technical solution—and you can recover 20-30% of it with the right approach.
Revenue metrics (MRR, ARR, ARPU)
Revenue metrics are your scoreboard—but only if you’re measuring net revenue, not gross. Here’s how to track what actually matters.
1. Measure net revenue
Gross revenue overstates business health. Account for store fees (15-30%), refunds, failed payments, and chargebacks.
Example: $100K gross ➡️ $70K net after Apple/Google cut + refunds.
Net revenue is what you actually keep. It’s what funds growth, pays the team, and determines profitability. If you’re optimizing for gross numbers, you’re optimizing for the wrong thing.
2. Break down MRR into its components
Monthly Recurring Revenue (MRR) is useful, but the real insight comes from understanding what drives it:
- New MRR (revenue from new subscribers);
- Expansion MRR (upgrades, upsells, add-ons);
- Churned MRR (revenue lost from cancellations);
- Contraction MRR (downgrades or pauses).
Each component tells a different growth story. Flat MRR could mean strong new signups are being offset by high churn. Breaking it down reveals where to act.
3. Don’t rely on ARPU alone
Average Revenue Per User (ARPU) masks distribution. A $50 ARPU doesn’t mean all users pay $50—it could be a few high-value subscribers subsidizing a large base of low spenders.
Combine ARPU with:
- ARPPU (Average Revenue Per Paying User): Revenue divided by paying users only;
- Median revenue: The middle value, which shows typical user value better than averages.
This approach helps you identify high-value vs. casual subscribers, and where pricing or packaging could better capture willingness to pay.
Engagement metrics
Daily and monthly active users (DAU/MAU) are common engagement metrics—but for subscription apps, they’re secondary to revenue. Here’s how to use them correctly.
1. Separate engagement metrics from revenue metrics
Some subscription apps require daily usage to deliver value—a fitness tracker, a meditation app, a language learning tool. For these products, DAU is a leading indicator of retention: users who stop engaging daily are likely to churn at renewal.
But other subscription apps provide value even with infrequent usage—a tax preparation tool, a recipe app, a travel planner. For these products, low DAU doesn’t signal a problem. Users might open the app once a month and still find tremendous value.
A recommended approach: analyze engagement metrics for user context (behavior patterns and retention risks), while using revenue metrics for driving decisions.
2. Identify engagement patterns that predict churn
For subscription apps, the relationship between engagement and retention isn’t always linear. Some users engage heavily, then drop off, then come back months later—but they keep their subscription active the whole time. Others use the app daily for weeks, then suddenly stop and churn immediately.
Group users by engagement behavior and track how each group performs over time. These insights transform engagement metrics from vanity numbers into retention levers.
Full subscription lifecycle analytics
1. Revenue happens over time, not only at conversion
Initial purchase is just the start. Track renewals, upgrades, and reactivations to see the full revenue picture.
A user who subscribes at $10/month might upgrade to $30/month in Month 3, pause in Month 6, and reactivate in Month 8. That’s three revenue events beyond the first conversion. Miss any of them, and you’re undervaluing the subscriber.
2. Monitor subscription health across all states
Active subscribers aren’t the only ones that matter. Track:
- Grace period (users with payment issues, still accessing the app);
- Billing retry (failed payment, retrying automatically);
- Paused (subscription on hold, may reactivate);
- Cancelled (churned, but might return).
Each state requires different retention interventions. Grace period users need billing support. Paused users might respond to a reactivation offer. Cancelled users could come back with a win-back campaign.
3. Link acquisition to long-term outcomes
Track acquisition source → LTV connection. Not every channel that drives installs drives revenue.
Optimize for quality subscribers, not just volume. A channel bringing 1,000 installs at $3 CPI with 2% LTV might underperform a channel bringing 500 installs at $6 CPI with 10% conversion and 3x LTV.
Cross-platform analytics
Subscription journeys don’t stay in one place. Users discover on web, convert in-app, or vice versa. Your analytics need to follow that path.
1. Connect web and app data
Subscription journeys span web and app—don’t treat them separately. Otherwise, you break attribution, LTV analysis, and revenue understanding.
A user might:
- Day 1: See your Facebook ad, click, explore your web quiz funnel;
- Day 3: Download app, try features;
- Day 5: See in-app paywall, subscribe.
If you only track app data, you miss the web funnel that qualified and warmed them up. If you only track web data, you miss that the app sealed the deal.
2. Attribute revenue to the right touchpoint
A user’s subscription journey often spans multiple touchpoints. The question: Which one gets credit for the revenue?
Attribution models:
- First-touch attribution: Facebook ad gets 100% credit (it started the journey);
- Last-touch attribution: In-app paywall gets 100% credit (it closed the sale);
- Multi-touch attribution: Credit is distributed across touchpoints (e.g., 50% + 50%).
If you only track last-touch, you might think “in-app paywalls drive all revenue”—when actually the web funnel qualified the user and built intent.
For subscription apps specifically:
- Web often handles: Acquisition, education, first-touch engagement
- App handles: Activation, retention, ongoing engagement
Without full-funnel visibility, you can’t tell which part of the journey actually drove the subscription.
Where web2app fits into subscription analytics
Most subscription apps focus on in-app analytics. But if you’re running web2app funnels, that’s only half the picture.
Why subscription app teams choose web2app
Adding a web layer to your acquisition strategy completes the cross-platform approach. Web2app funnels unlock:
- Clearer visibility into revenue performance across the full lifecycle;
- Better tracking (no IDFA limitations);
- Faster iteration (no in-app purchase configuration limitations);
- More control over pricing experiments and paywall tests.
Web2app analytics unlock new insights
App store analytics show you what happened—user subscribed, user churned. Web analytics show you why: which message resonated, where they hesitated, what convinced them.
Web-to-app analytics can track how users move through paywalls, pricing experiments, and purchase flows. It focuses on revenue outcomes, not just conversions. Platforms with built-in cohort analysis take this further, letting you measure the long-term impact of every change you make.
FunnelFox approach to subscription analytics
FunnelFox is built specifically for subscription apps that want revenue clarity. Here’s how it helps:
- Tracks full web2app journeys. Quiz → paywall → purchase → in-app activation.
- Focuses on revenue outcomes. Not just clicks and conversions, but LTV, retention, and churn.
- Built-in cohort analysis. Compare how different user groups perform over time.
For subscription apps that need analytics tied to revenue, FunnelFox provides the visibility to make better decisions faster.
Book a demo to see how FunnelFox can transform your subscription analytics.
Wrap-up: Mobile app analytics best practices for subscription growth
Subscription analytics is effective when you track what matters. Most teams drown in data, building dashboards with dozens of metrics that look impressive but don’t drive decisions. The key to effective mobile app analytics is to identify the metrics that directly tie to revenue, measure them correctly, and use them to guide every growth decision you make.
Focus on:
- Lifecycle approach;
- Net revenue;
- Cohort analysis;
- Cross-platform tracking.
With the right mobile app strategy and the right analytics approach, you stop guessing and start growing. You see which experiments move retention, which campaigns bring real LTV, and which parts of the experience create loyal subscribers.