


This post is based on a talk at Apps in Motion, a conference on mobile app growth hosted by FunnelFox and Adapty at Nasdaq HQ, New York. Watch the full session.
Web2app is one of the fastest-growing monetization formats in mobile. But almost no one can accurately measure it because there’s no public data on web2app revenue. Most teams have no idea who’s winning in this market or why.
I’ve been operating in web2app for four years, building funnels, running acquisition, and trying to see what the standard tools can’t show. 15 years in B2C subscriptions, $150M+ in Meta spend, Zing Coach ($0→$3.5M/mo), an AI mental health app ($0→$1M MRR), 150+ teams through Web Funnels Club. Along the way, I built a database of 1,000+ competitor funnels, scraped creative data from Meta at scale, and tracked it month over month.
This is what I found: where the market is growing, what got the top performers ahead, what’s keeping them there, and what’s working on the web side right now.
The data problem: why intelligence tools miss web revenue
There’s a blind spot in web2app competitive research: the tools most teams rely on measure the wrong thing.
Sensor Tower and AppFollow track App Store and Google Play revenue. But apps doing web2app process payments through Stripe or Paddle, and that data is completely invisible to these tools.
Real example: one fitness and nutrition app shows $2,000/month in Sensor Tower. But its actual revenue is $10M/month — a 50x difference. That’s a competitor you’d write off as a rounding error while they’re one of the biggest players in your space.
Standard competitive analysis simply doesn’t work in web2app.
Creative volume as a proxy
There is one dataset that’s both public and meaningful: ad creatives. Web2app is almost entirely performance-marketing-driven, which means creative output and spend move together. The more a team is spending, the more creatives they’re producing and testing.
Mapping competitor funnels over time, scraping creative data at scale, and tracking volume month over month gives you a usable signal. From each creative, you can extract the angle, target persona, and offer structure, so you can track not just how much a competitor is investing but where they’re doubling down right now.
What the data shows
The market is growing (and faster than it looks)
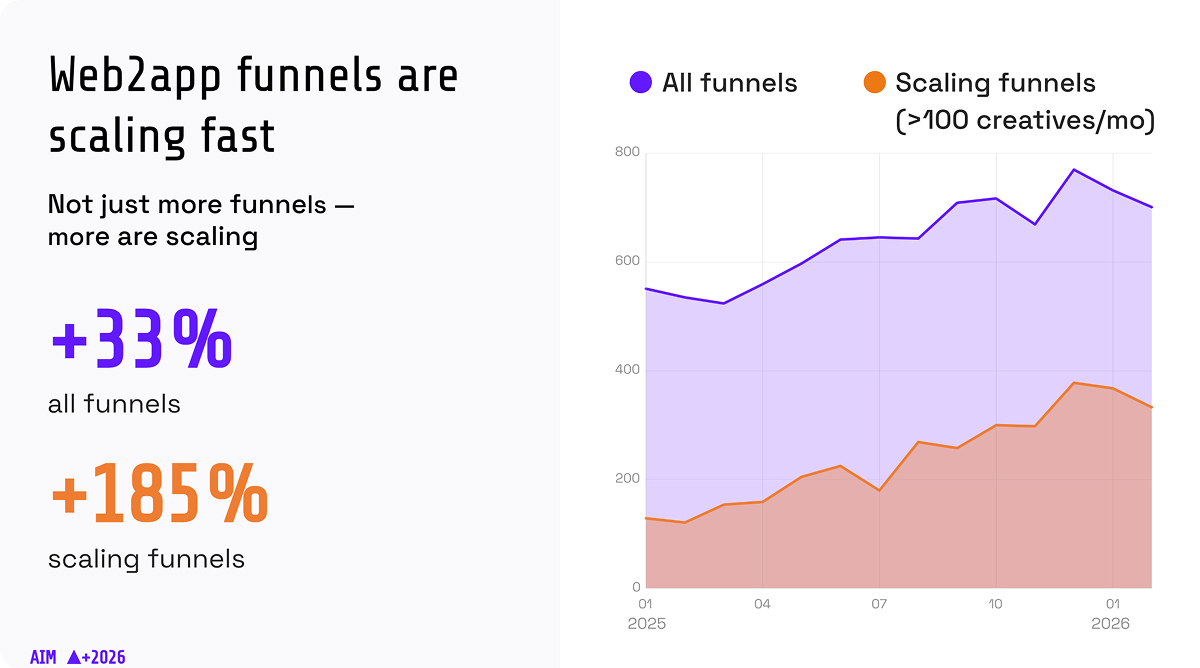
The number of new web2app funnels grew 33% year over year. But filter for funnels producing more than 100 creatives per month, and the growth rate jumps to 185%.
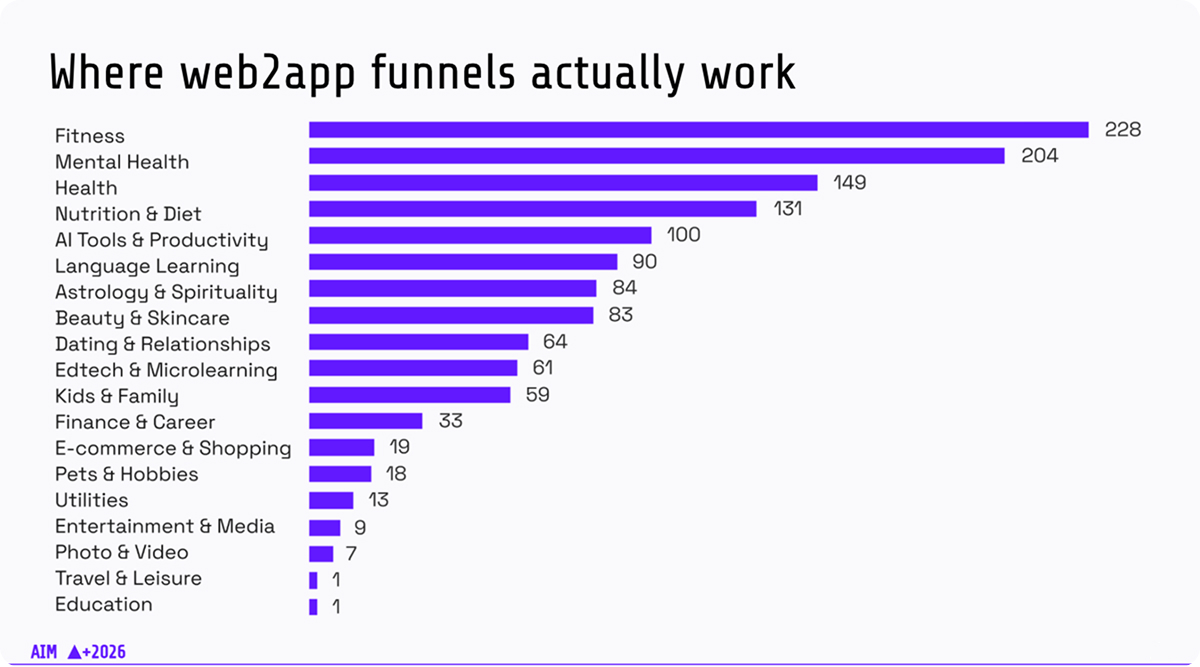
The categories leading that growth are predictable at the top, but web2app is no longer a fitness-and-wellness format. It’s expanding across almost every subscription category.
Who’s leading by volume
| App | Category | Funnel topics | Creatives/year |
| BetterMe | Fitness, nutrition | Wall pilates, yoga, calisthenics, fasting | 687K |
| Liven | Mental health | Burnout, anxiety, relations, parenting | 286K |
| Coursiv | Education | AI skills course | 285K |
| Nebula | Astrology | Love compatibility, soulmate, past life | 206K |
| Simple | Fitness, nutrition | Fasting, weight loss, wall pilates, walking | 161K |
| Mad Muscles | Fitness, nutrition | Calisthenics, pilates, tai chi | 160K |
| Dressly | AI wardrobe | 160K |
Who’s growing fastest
| App | Category | H1 2026 | H2 2026 | H2 vs H1 |
| Nordletics | Fitness, nutrition | 175K | 17K | +9000% |
| Tixu | Education | 1K | 28K | +2000% |
| MyIQ | IQ tests | 2K | 29K | +1300% |
| Paw Champ | Pets | 5K | 75K | +1200% |
| Finelo | Education | 7K | 72K | +800% |
| AI Learna | Language learning | 3K | 26K | +800% |
| Smartyme | Education | 8K | 74K | +750% |
Scale is driven by diversification, not optimization
Looking at what separates top performers from everyone else, the pattern isn’t that they found something that works and scaled it. It’s that they diversify across three layers simultaneously.
1. Creatives
Top 1% of advertisers produce 10 to 15 times more creatives per month than the median. At that volume, the goal isn’t to find a winning creative but to build a system that produces winning creatives regularly. The unit of competition shifted from the creative to the creative engine.
Two things drove this shift:
- After Meta’s Andromeda update rolled out, there’s a visible spike in creative volume across the market — teams started testing significantly more.
- AI tools enabled high-volume production.
What changed in practice: you now test not just variations of the same creative, but different angles and personas entirely. And the campaign structure shifted too — previously each creative ran separately with its own budget. Now the dominant approach is uploading many creatives into a single ad set and letting Meta’s algorithm allocate spend. Less manual management, more system-level thinking.
2. Funnels
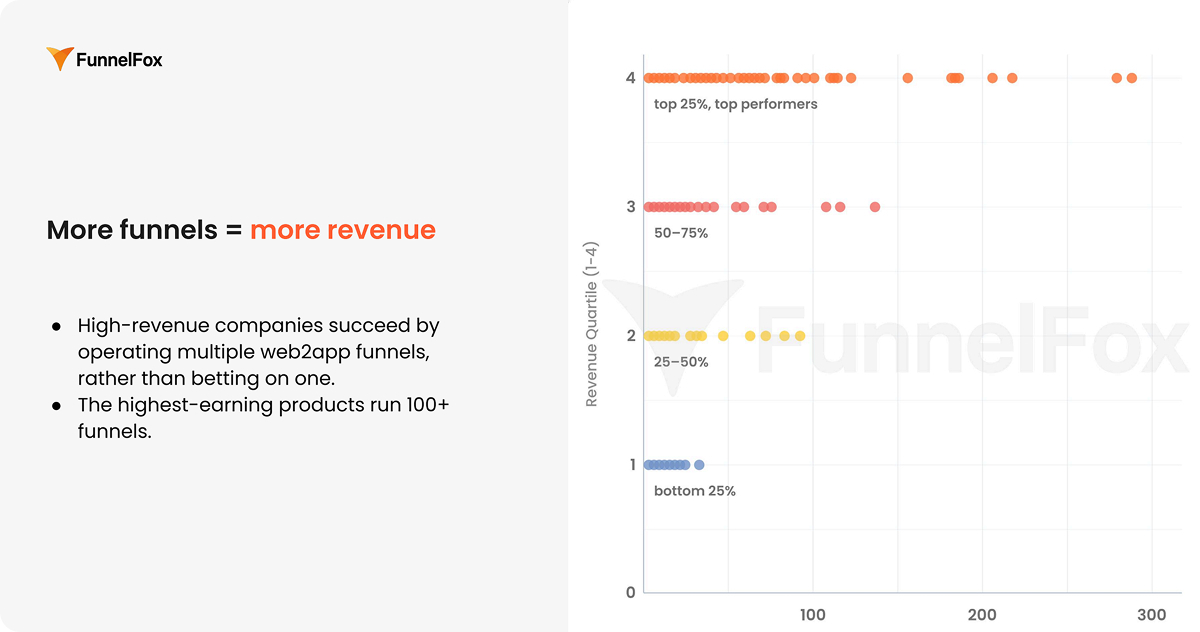
FunnelFox data shows a clear correlation between the number of unique funnels a team runs and their revenue. The logic is straightforward: web2app unlocks personalization that’s impossible through the App Store. Different personas, segments, entry points — each gets its own funnel. One funnel serves one segment. If you have ten segments, you need ten funnels.
3. Facebook accounts
One branded page isn’t enough at scale. Top players run ads from multiple accounts — partly for technical resilience against bans, partly for message matching. An ad from a persona account rather than a brand page can perform very differently with the same creative. Liven, for example, runs ads from an account called “Olivia Parker” structured to look like a real person, not a company.
Monetization has standardized
Across the funnels in this dataset, paywall structure has converged on a clear template: three pricing options plus an introductory offer on the first subscription period.
Three options provide enough choice without decision paralysis, and the introductory offer reduces the barrier to starting, and price anchoring makes the middle option feel reasonable.
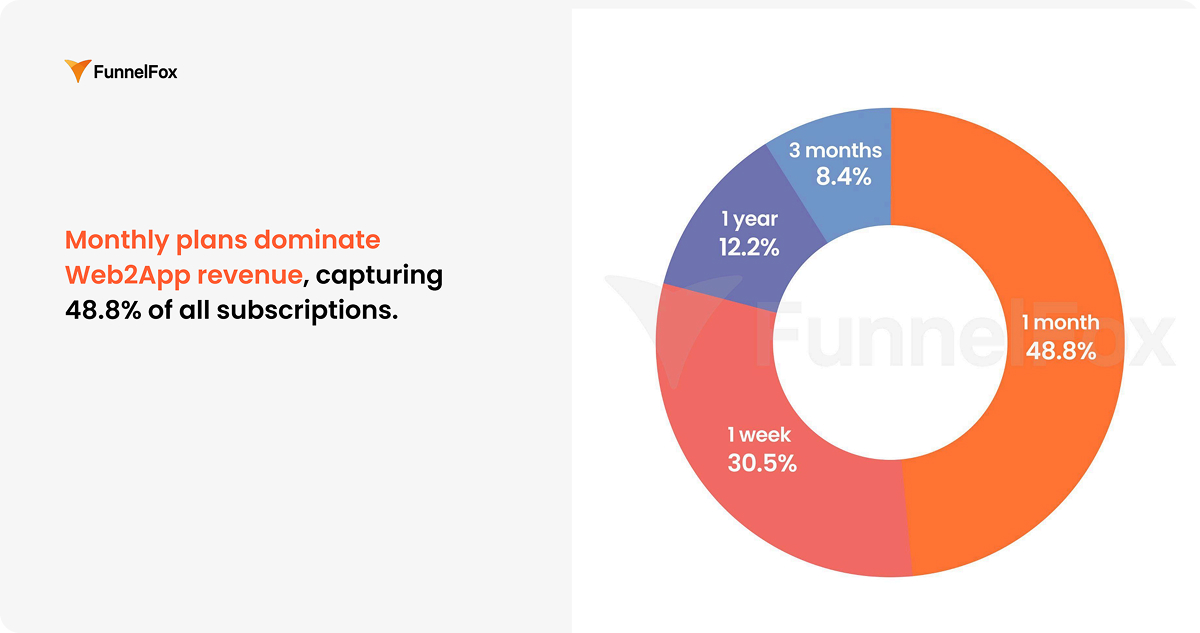
The most popular subscription periods are one week and one month — short enough that the commitment feels low at the moment of conversion.
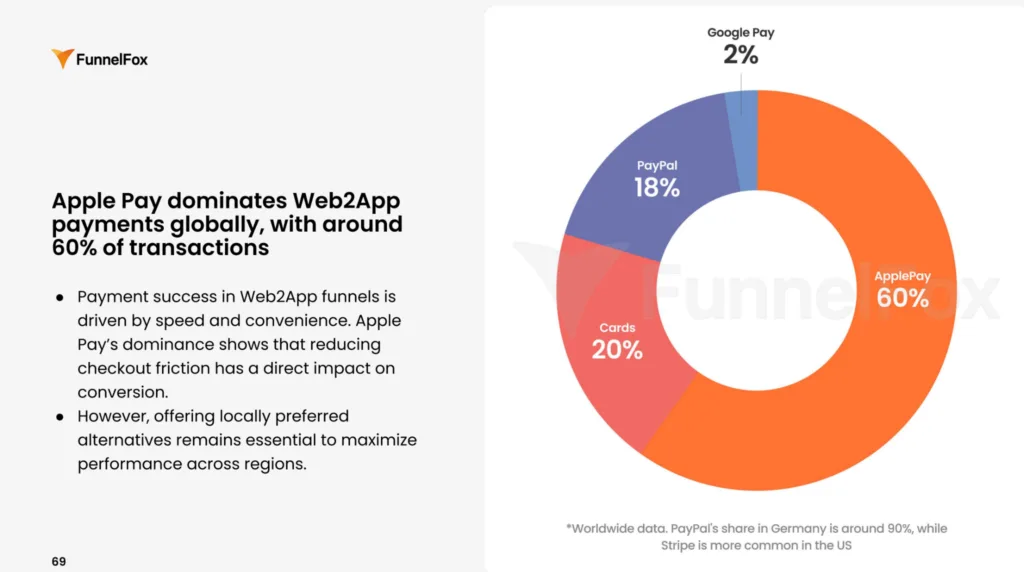
On checkout, Apple Pay has become the dominant payment method in web2app funnels. It’s a one-click experience with no card entry required — and that alone accounts for a 20–30% lift in conversion compared to standard card checkout or PayPal, according to FunnelFox research.
Universal patterns and trends in web2app
Web2app unlocks something that direct App Store acquisition doesn’t: full control over the onboarding experience. But the patterns that drive conversion differ by category — different elements, different logic, different definitions of what “value before the paywall” means.
How storytelling differs across categories
Fitness and nutrition: point A → point B
Key elements: instant personalization, weight outcome prediction, social proof
Fitness has a wide range of target personas — weight loss, muscle building, Pilates, yoga, calisthenics, running, seniors managing joint health. It could still be the same app, but with completely different requirements from users. Web2app lets you build separate funnels for all of them.
The anchor element is weight outcome prediction: a chart built from current weight, target weight, and timeline. It personalizes the experience and creates a credible outcome simultaneously. Paired with before/after stories and scientific framing — how calorie deficit or metabolism works — the funnel converts because it feels specific, not generic.
Mental health: feel understood first, then sell
Key elements: instant personalization, emotional self-assessment, personalized insight
In mental health, there’s no physical outcome to predict. The onboarding has to make users feel seen and understood before any product pitch. That means emotional self-assessment: questions about feelings, images to interpret, sounds to describe. The output mirrors the weight chart in fitness — for example, a personalized score, a cortisol report, a stress level assessment — that says here’s where you are, and here’s what that means.
Language learning: demonstrate the product
Key elements: instant personalization, level assessment, real-time AI feedback
The structure is similar: a level assessment establishes point A, a projected improvement chart shows point B. But the most interesting execution goes further. Fluently lets users speak to an AI tutor directly in the web onboarding, before the paywall, and shows real-time feedback on their performance. That’s not just personalization — it’s a product demo that creates intent before asking for money.
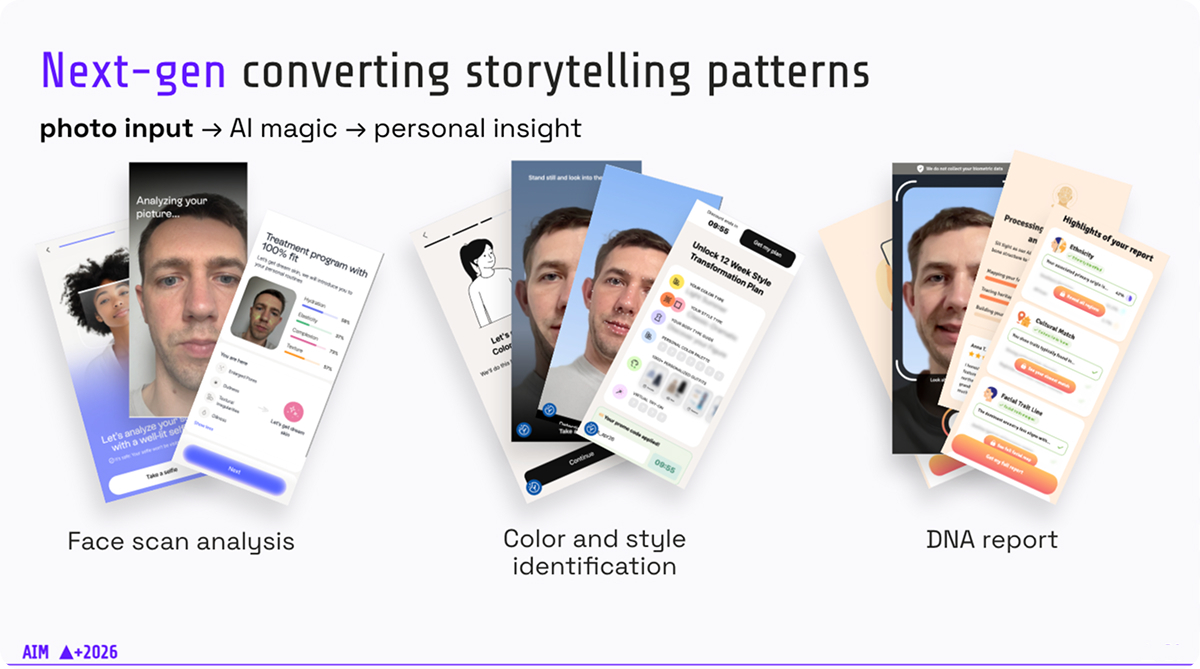
AI-powered personalization: where the industry is going
The pattern emerging across categories is: photo input → AI processing → personal insight. A face scanner returns a detailed skin analysis from a selfie. An AI stylist identifies colors and styles based on a photo. A DNA app detects ethnicity, traits, and cultural matches.
This works better in web onboarding than in-app because there’s no App Store install between the ad and the experience. Intent doesn’t get lost in a redirect. You capture it, process it, and show the paywall while it’s still live.
Key takeaways
The market is still expanding — and accelerating at the top. New web2app funnels grew 33% year over year. Among funnels producing 100+ creatives per month, the growth rate is 185%. Fitness and mental health lead, but the expansion is now crossing into education, language learning, AI tools, and utilities.
Diversification drives scale. Top 1% of advertisers produce 10–15x more creatives than the median. There’s a direct correlation between the number of unique funnels and revenue. One branded Facebook page isn’t enough — top players run multiple accounts for both resilience and message matching. The teams pulling ahead are doing all three simultaneously, not sequentially.
Monetization has a working template — use it. Three pricing options plus an introductory offer is the market default. Apple Pay dominates checkout because it’s one-click, with a 20–30% conversion lift over card or PayPal. Nothing here needs to be invented.
Web onboarding is becoming a personalized story. Fitness predicts your weight. Mental health scores your stress. Language apps assess your level in real time. AI is making all of this more specific and harder to replicate — that’s the direction the industry is moving.